ファイル:1000 Year Temperature Comparison.png

ページのコンテンツが他言語でサポートされていません。

1000_Year_Temperature_Comparison.png(599 × 442 ピクセル、ファイルサイズ: 32キロバイト、MIME タイプ: image/png)

このグラフ画像は、ベクターイメージである SVG ファイルとして再作成されるべきです。これにはいくつかの利点があります。詳しくはCommons:Media for cleanupを参照してください。この画像の SVG 形式がすでに利用可能である場合は、アップロードしてください。アップロード後、この画像にあるこのテンプレートを{{Vector version available|新しい画像ファイル名.svg}}テンプレートで置き換えてください。

概要

解説
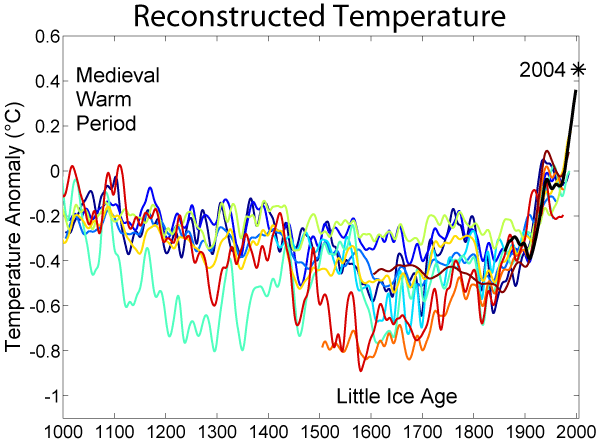
English: This image is a comparison of 10 different published reconstructions of mean temperature changes during the 2nd millennium. More recent reconstructions are plotted towards the front and in redder colors, older reconstructions appear towards the back and in bluer colors. An instrumental history of temperature is also shown in black. The medieval warm period and little ice age are labeled at roughly the times when they are historically believed to occur, though it is still disputed whether these were truly global or only regional events. The single, unsmoothed annual value for 2004 is also shown for comparison. (Image:Instrumental Temperature Record.png shows how 2004 relates to other recent years).

It is unknown which, if any, of these reconstructions is an accurate representation of climate history; however, these curves are a fair representation of the range of results appearing in the published scientific literature. Hence, it is likely that such reconstructions, accurate or not, will play a significant role in the ongoing discussions of global climate change and global warming.

For each reconstruction, the raw data has been decadally smoothed with a σ = 5 yr Gaussian weighted moving average. Also, each reconstruction was adjusted so that its mean matched the mean of the instrumental record during the period of overlap. The variance (i.e. the scale of fluctuations) was not adjusted (except in one case noted below).

Except as noted below, all original data for this comparison comes from here and links therein. It should also be noted that many reconstructions of past climate report substantial error bars, which are not represented on this figure.
日付
原典 http://www.globalwarmingart.com/wiki/File:1000_Year_Temperature_Comparison.png
作者 Robert A. Rohde
その他のバージョン

Reconstructions

The reconstructions used, in order from oldest to most recent publication are:

  1. (dark blue 1000-1991): The Holocene.
  2. (blue 1000-1980): Geophysical Research Letters.
  3. (light blue 1000-1965): Ambio. Modified as published in Science.
  4. (lightest blue 1402-1960): J. Geophys. Res..
  5. (light green 831-1992): Science.
  6. (yellow 200-1980): Geophysical Research Letters. doi:10.1029/2003GL017814.
  7. (orange 200-1995): Reviews of Geophysics. doi:10.1029/2003RG000143
  8. (red-orange 1500-1980): Geophys. Res Lett.. doi:10.1029/2004GL019781
  9. (red 1-1979): Nature. doi:10.1038/nature03265
  10. (dark red 1600-1990): Science. doi:10.1126/science.1107046

(black 1856-2004): Instrumental data was jointly compiled by the Climatic Research Unit and the UK Meteorological Office Hadley Centre. Global Annual Average data set TaveGL2v [1] was used.

Documentation for the most recent update of the CRU/Hadley instrumental data set appears in: Journal of Climate.

ライセンス

The original version of this figure was prepared by Robert A. Rohde from publicly available data and is incorporated into the Global Warming Art project.

Image from Global Warming Art
This image is an original work created for Global Warming Art. Please refer to the Year Temperature Comparison.png image description page for more information.
GNU head この文書は、フリーソフトウェア財団発行のGNUフリー文書利用許諾書 (GNU Free Documentation License) 1.2またはそれ以降のバージョンの規約に基づき、複製や再配布、改変が許可されます。不可変更部分、表紙、背表紙はありません。このライセンスの複製は、GNUフリー文書利用許諾書という章に含まれています。
w:ja:クリエイティブ・コモンズ
表示 継承
このファイルはクリエイティブ・コモンズ 表示-継承 3.0 非移植ライセンスのもとに利用を許諾されています。
あなたは以下の条件に従う場合に限り、自由に
  • 共有 – 本作品を複製、頒布、展示、実演できます。
  • 再構成 – 二次的著作物を作成できます。
あなたの従うべき条件は以下の通りです。
  • 表示 – あなたは適切なクレジットを表示し、ライセンスへのリンクを提供し、変更があったらその旨を示さなければなりません。これらは合理的であればどのような方法で行っても構いませんが、許諾者があなたやあなたの利用行為を支持していると示唆するような方法は除きます。
  • 継承 – もしあなたがこの作品をリミックスしたり、改変したり、加工した場合には、あなたはあなたの貢献部分を元の作品とこれと同一または互換性があるライセンスの下に頒布しなければなりません。
このライセンスのテンプレートは、GFDLのライセンス・アップデートによりこのファイルに追加されたものです。


Notes

  1. Data from Moberg et al. was taken directly from the supplemental information accompanying the Nature article.
  2. Data for Oerlemans was provided by William M. Connolley.
  3. Esper et al. reported only fluctuations in "arbitrary" units, so the variance in this record was rescaled to match the variance during the period of overlap with the instrumental record.
  4. When a paper included multiple reconstructions, the global annually average temperature data was used. If this was not reported, then Northern Hemisphere annually averaged data was used.
  5. Four records appearing at [2] were not used in preparing this graph for the following reasons:
    1. Mann et al. 98 was not included because Mann et al. 99 extended and updated that record.
    2. Briffa et al. 98 was not included because Briffa et al. 2001 extended and updated that record.
    3. Pollack et al. 98 was not included because the reported data was not found to be in a form that allowed for easy replotting.
    4. Mann et al. 2000 was not used because it did not include an original reconstruction covering at least the Northern Hemisphere.


Dragons flight's Temperature Record Series
This figure is part of a series of plots created by Dragons flight to illustrate
changes in Earth's temperature and climate across many different time scales.
Time Period: 25 yrs | 150 yrs | 1 kyr | 2 kyr | 12 kyr | 450 kyr | 5 Myr | 65 Myr | 500 Myr
For articles related to this topic see: Temperature record

キャプション

このファイルの内容を1行で記述してください

このファイルに描写されている項目

題材

18 11 2005

896104465de636e551cb77de82d0892e1e892551

32,749 バイト

442 ピクセル

599 ピクセル

ファイルの履歴

過去の版のファイルを表示するには、その版の日時をクリックしてください。

日付と時刻サムネイル寸法利用者コメント
現在の版2019年11月21日 (木) 23:142019年11月21日 (木) 23:14時点における版のサムネイル599 × 442 (32キロバイト)MyridiumSomebody updated the image with a "2016" label that isn't even included in the data analysed! Data analysed only goes up to 2004.
2019年5月5日 (日) 06:542019年5月5日 (日) 06:54時点における版のサムネイル599 × 500 (48キロバイト)TobusUpdate to show 2016 temperature anomaly
2014年7月16日 (水) 17:102014年7月16日 (水) 17:10時点における版のサムネイル599 × 442 (32キロバイト)JeffyPShrinkin' the image.
2005年12月17日 (土) 22:512005年12月17日 (土) 22:51時点における版のサムネイル599 × 442 (40キロバイト)Saperaud~commonswiki*'''Description:''' [[en:Image:{{subst:PAGENAME}}]]

以下の​ 3 ページがこのファイルを使用しています:

グローバルなファイル使用状況

以下に挙げる他のウィキがこの画像を使っています: