
ファイル:Glacier Mass Balance Map.png
Glacier_Mass_Balance_Map.png (650 × 477 ピクセル、ファイルサイズ: 75キロバイト、MIME タイプ: image/png)
ウィキメディア・コモンズのファイルページにある説明を、以下に表示します。
|
概要
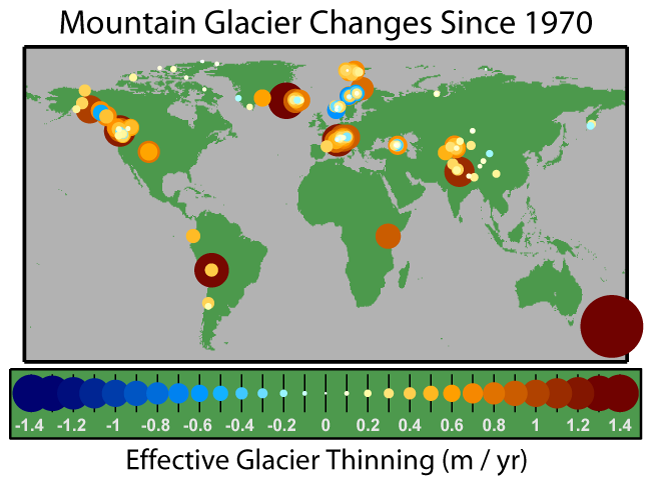
The effective rate of change in glacier thickness, also known as the glaciological mass balance, is a measure of the average change in a glacier's thickness after correcting for changes in density associated with the compaction of snow and conversion to ice. The map shows the average annual rate of thinning since 1970 for the 173 glaciers that have been measured at least 5 times between 1970 and 2004 (Dyurgerov and Meier 2005). Larger changes are plotted as larger circles and towards the back.
All survey regions except Scandinavia show a net thinning. This widespread glacier retreat is generally regarded as a sign of global warming.
During this period, 83% of surveyed glaciers showed thinning with an average loss across all glaciers of 0.31 m/yr. The most rapidly growing glacier in the sample is Engabreen glacier in Norway with a thickening of 0.64 m/yr. The most rapidly shrinking was Ivory glacier in New Zealand which was thinning at 2.4 m/yr. Ivory glacier had totally disintegrated by circa 1988 [1].
Copyright
This figure was originally prepared by Rober A. Rohde from published data and is incorporated into the Global Warming Art project.

|
この文書は、フリーソフトウェア財団発行のGNUフリー文書利用許諾書 (GNU Free Documentation License) 1.2またはそれ以降のバージョンの規約に基づき、複製や再配布、改変が許可されます。不可変更部分、表紙、背表紙はありません。このライセンスの複製は、GNUフリー文書利用許諾書という章に含まれています。 |
| このファイルはクリエイティブ・コモンズ 表示-継承 3.0 非移植ライセンスのもとに利用を許諾されています。 | ||
| ||
| このライセンスのテンプレートは、GFDLのライセンス・アップデートによりこのファイルに追加されたものです。 |
Notes
This sample of mountain glaciers excludes the primary ice sheets of Greenland and Antarctica.
It should be acknowledged that glacier sampling is heavily biased towards North America and Europe. Africa has only a handful of glaciers, whereas continental Australia has none. However substantial unsampled mountain glaciers do exist in South America, Asia and the margins of Antarctica. Despite their importance, none of the marginal Antarctic glaciers have had their mass balance sampled at least 5 times since 1970.
These estimates of ice sheet thinning do not include glacier mass lost due to iceberg calving. Such calving is not significant for most mountain glaciers, since only a small proportion of these glaciers terminate in the ocean.
Reference
- Dyurgerov, Mark B. and Mark F. Meier (2005). "Glaciers and the Changing Earth System: A 2004 Snapshot". Institute of Arctic and Alpine Research, Occasional Paper 58.
Other versions
-
 Portuguese
.png)
ファイルの履歴
過去の版のファイルを表示するには、その版の日時をクリックしてください。
| 日付と時刻 | サムネイル | 寸法 | 利用者 | コメント | |
|---|---|---|---|---|---|
| 現在の版 | 2016年10月2日 (日) 15:56 | | 650 × 477 (75キロバイト) | Cmdrjameson | Compressed with pngout. Reduced by 33kB (30% decrease). |
| 2006年4月10日 (月) 06:48 |  | 650 × 477 (108キロバイト) | Pflatau | == Summary == The effective rate of change in glacier thickness, also known as the glaciological mass balance, is a measure of the average change in a glacier's thickness after correcting for changes in density associated with the compaction o |
ファイルの使用状況
以下のページがこのファイルを使用しています:
グローバルなファイル使用状況
以下に挙げる他のウィキがこの画像を使っています:
- ar.wikipedia.org での使用状況
- cs.wikipedia.org での使用状況
- de.wikipedia.org での使用状況
- en.wikipedia.org での使用状況
- User:Dragons flight/Images
- Holocene glacial retreat
- Glacier mass balance
- Retreat of glaciers since 1850
- Talk:Retreat of glaciers since 1850/Archive 2
- Wikipedia:Reference desk/Archives/Science/2006 September 26
- Portal:Climate change/Selected panorama
- Portal:Climate change/Selected panorama/2
- User:Ctello2/sandbox
- es.wikipedia.org での使用状況
- eu.wikipedia.org での使用状況
- fi.wikipedia.org での使用状況
- fr.wikipedia.org での使用状況
- gl.wikipedia.org での使用状況
- gu.wikipedia.org での使用状況
- hi.wikipedia.org での使用状況
- hr.wikipedia.org での使用状況
- hu.wikipedia.org での使用状況
- hy.wikipedia.org での使用状況
- id.wikipedia.org での使用状況
- it.wikipedia.org での使用状況
- nl.wikipedia.org での使用状況
- pl.wikipedia.org での使用状況
- ru.wikipedia.org での使用状況
- sh.wikipedia.org での使用状況
- sr.wikipedia.org での使用状況
- sw.wikipedia.org での使用状況
- ta.wikipedia.org での使用状況
- tt.wikipedia.org での使用状況
- vi.wikipedia.org での使用状況
- zh.wikipedia.org での使用状況