
ファイル:Window function (rectangular).png
このプレビューのサイズ: 800 × 359 ピクセル。 その他の解像度: 320 × 144 ピクセル | 640 × 287 ピクセル | 1,024 × 460 ピクセル | 1,280 × 575 ピクセル | 2,500 × 1,123 ピクセル。
元のファイル (2,500 × 1,123 ピクセル、ファイルサイズ: 83キロバイト、MIME タイプ: image/png)
ウィキメディア・コモンズのファイルページにある説明を、以下に表示します。
|
en.wikipedia からコモンズに Tiaguito によって移動されました。
概要
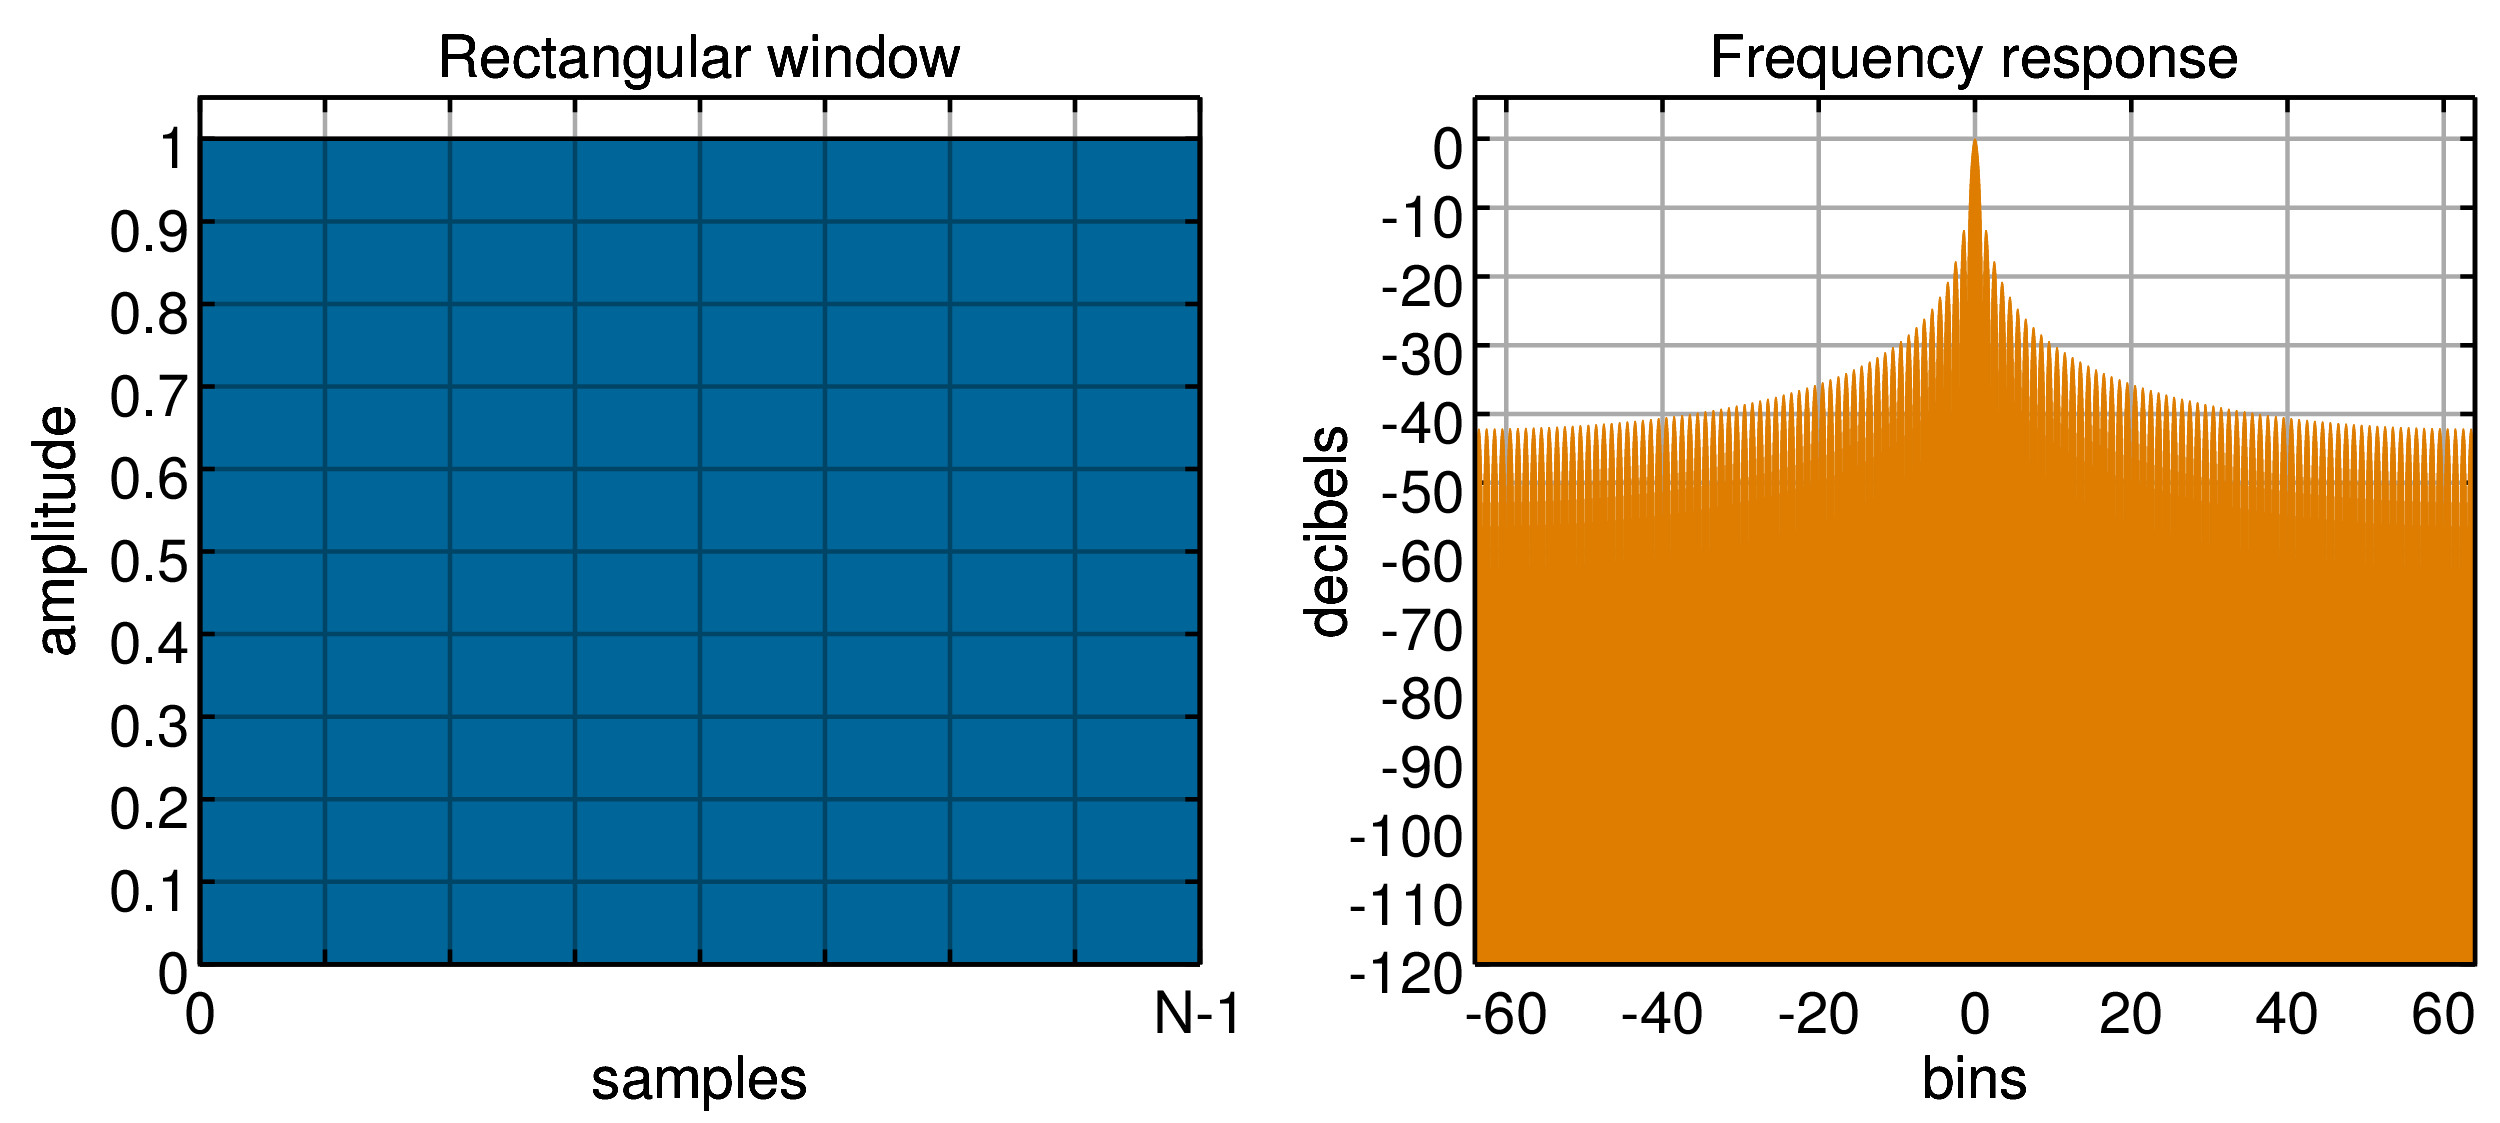
| 解説 | rectangular window and frequency response | |||
| 日付 | ||||
| 原典 | 投稿者自身による著作物 | |||
| 作者 | Bob K (original version), Olli Niemitalo | |||
| 許可 (ファイルの再利用) |
|
|||
| その他のバージョン |
|
|||
| Source code | The script below generates these .png images:
This script has not been tested in MATLAB. See the individual file histories for the simpler MATLAB scripts that were the basis of this script. Generation of svg files by minor modification of the script displayed visual artifacts and renderer incompatibilities that could not be easily fixed. The current script fixes the visual artifacts in the png file as a post-processing step. The script generates a semi-transparent grid by taking a weighted average of two images, one with the grid and one without.Matlabfunction plotWindowLayer (w, N, gridded, wname, wspecifier)
M=32;
k=0:N-1;
dr = 120;
H = abs(fft([w zeros(1,(M-1)*N)]));
H = fftshift(H);
H = H/max(H);
H = 20*log10(H);
H = max(-dr,H);
figure('Position',[1 1 1200 520])
subplot(1,2,1)
set(gca,'FontSize',28)
area(k,w,'FaceColor', [0 1 1],'edgecolor', [1 1 0],'linewidth', 2)
xlim([0 N-1])
if (min(w) >= -0.01)
ylim([0 1.05])
set(gca,'YTick', [0 : 0.1 : 1])
ylabel('amplitude','position',[-16 0.525 0])
else
ylim([-1 5])
set(gca,'YTick', [-1 : 1 : 5])
ylabel('amplitude','position',[-16 2 0])
endif
set(gca,'XTick', [0 : 1/8 : 1]*(N-1))
set(gca,'XTickLabel',[' 0'; ' '; ' '; ' '; ' '; ' '; ' '; ' '; 'N-1'])
grid(gridded)
set(gca,'LineWidth',2)
set(gca,'gridlinestyle','-')
xlabel('samples')
if (strcmp (wspecifier, ""))
title(cstrcat(wname,' window'))
else
title(cstrcat(wname,' window (', wspecifier, ')'))
endif
set(gca,'Position',[0.08 0.11 0.4 0.8])
set(gca,'XColor',[1 0 1])
set(gca,'YColor',[1 0 1])
subplot(1,2,2)
set(gca,'FontSize',28)
h = stem(([1:M*N]-1-M*N/2)/M,H,'-');
set(h,'BaseValue',-dr)
ylim([-dr 6])
set(gca,'YTick', [0 : -10 : -dr])
set(findobj('Type','line'),'Marker','none','Color',[0 1 1])
xlim([-M*N/2 M*N/2]/M)
grid(gridded)
set(findobj('Type','gridline'),'Color',[.871 .49 0])
set(gca,'LineWidth',2)
set(gca,'gridlinestyle','-')
ylabel('decibels')
xlabel('bins')
title('Frequency response')
set(gca,'Position',[0.59 0.11 0.4 0.8])
set(gca,'XColor',[1 0 1])
set(gca,'YColor',[1 0 1])
endfunction
function plotWindow (w, wname, wspecifier = "", wfilespecifier = "")
if (strcmp (wfilespecifier, ""))
wfilespecifier = wspecifier;
endif
N = size(w)(2);
B = N*sum(w.^2)/sum(w)^2 % noise bandwidth (bins), set N = 4096 to get an accurate estimate
plotWindowLayer(w, N, "on", wname, wspecifier); % "gridded" = "on"
print temp1.png -dpng "-S2500,1165"
close
plotWindowLayer(w, N, "off", wname, wspecifier); % "gridded" = "off"
print temp2.png -dpng "-S2500,1165"
close
% I'm not sure what's going on here, but it looks like the author might have been able
% to save himself some time by using set(gca,"Layer","top") and set(gca,"Layer","bottom").
I = imread ("temp1.png");
J = imread ("temp2.png");
info = imfinfo ("temp1.png");
w = info.Width;
c = 1-(double(I(:,1:w/2,1))+2*double(J(:,1:w/2,1)))/(255*3);
m = 1-(double(I(:,1:w/2,2))+2*double(J(:,1:w/2,2)))/(255*3);
y = 1-(double(I(:,1:w/2,3))+2*double(J(:,1:w/2,3)))/(255*3);
c = ((c != m) | (c != y)).*(c > 0).*(1-m-y);
I(:,1:w/2,1) = 255*(1-c-m-y + 0*m + 0*y + 0*c);
I(:,1:w/2,2) = 255*(1-c-m-y + 0*m + 0*y + 0.4*c);
I(:,1:w/2,3) = 255*(1-c-m-y + 0*m + 0*y + 0.6*c);
c = 1-(double(I(:,w/2+1:w,1))+2*double(J(:,w/2+1:w,1)))/(255*3);
m = 1-(double(I(:,w/2+1:w,2))+2*double(J(:,w/2+1:w,2)))/(255*3);
y = 1-(double(I(:,w/2+1:w,3))+2*double(J(:,w/2+1:w,3)))/(255*3);
c = ((c != m) | (c != y)).*c;
I(:,w/2+1:w,1) = 255*(1-c-m-y + 0*m + 0*y + 0.8710*c);
I(:,w/2+1:w,2) = 255*(1-c-m-y + 0*m + 0*y + 0.49*c);
I(:,w/2+1:w,3) = 255*(1-c-m-y + 0*m + 0*y + 0*c);
if (strcmp (wfilespecifier, ""))
imwrite (I, cstrcat('Window function and frequency response - ', wname, '.png'));
else
imwrite (I, cstrcat('Window function and frequency response - ', wname, ' (', wfilespecifier, ').png'));
endif
endfunction
N=128;
k=0:N-1;
w = 0.42 - 0.5*cos(2*pi*k/(N-1)) + 0.08*cos(4*pi*k/(N-1));
plotWindow(w, "Blackman")
w = 0.355768 - 0.487396*cos(2*pi*k/(N-1)) + 0.144232*cos(4*pi*k/(N-1)) -0.012604*cos(6*pi*k/(N-1));
plotWindow(w, "Nuttall", "continuous first derivative")
w = 1 - 1.93*cos(2*pi*k/(N-1)) + 1.29*cos(4*pi*k/(N-1)) -0.388*cos(6*pi*k/(N-1)) +0.032*cos(8*pi*k/(N-1));
plotWindow(w, "Flat top")
w = 1 - 1.93*cos(2*pi*k/(N-1)) + 1.29*cos(4*pi*k/(N-1)) -0.388*cos(6*pi*k/(N-1)) +0.028*cos(8*pi*k/(N-1));
plotWindow(w, "SRS flat top")
w = ones(1,N);
plotWindow(w, "Rectangular")
w = (N/2 - abs([0:N-1]-(N-1)/2))/(N/2);
plotWindow(w, "Triangular")
w = 0.5 - 0.5*cos(2*pi*k/(N-1));
plotWindow(w, "Hann")
w = 0.53836 - 0.46164*cos(2*pi*k/(N-1));
plotWindow(w, "Hamming", "alpha = 0.53836")
alpha = 0.5;
w = ones(1,N);
n = -(N-1)/2 : -alpha*N/2;
L = length(n);
w(1:L) = 0.5*(1+cos(pi*(abs(n)-alpha*N/2)/((1-alpha)*N/2)));
w(N : -1 : N-L+1) = w(1:L);
plotWindow(w, "Tukey", "alpha = 0.5")
w = sin(pi*k/(N-1));
plotWindow(w, "Cosine")
w = sinc(2*k/(N-1)-1);
plotWindow(w, "Lanczos")
w = ((N-1)/2 - abs([0:N-1]-(N-1)/2))/((N-1)/2);
plotWindow(w, "Bartlett")
sigma = 0.4;
w = exp(-0.5*( (k-(N-1)/2)/(sigma*(N-1)/2) ).^2);
plotWindow(w, "Gaussian", "sigma = 0.4")
w = 0.62 -0.48*abs(k/(N-1) -0.5) +0.38*cos(2*pi*(k/(N-1) -0.5));
plotWindow(w, "Bartlett–Hann")
alpha = 2;
w = besseli(0,pi*alpha*sqrt(1-(2*k/(N-1) -1).^2))/besseli(0,pi*alpha);
plotWindow(w, "Kaiser", "alpha = 2")
alpha = 3;
w = besseli(0,pi*alpha*sqrt(1-(2*k/(N-1) -1).^2))/besseli(0,pi*alpha);
plotWindow(w, "Kaiser", "alpha = 3")
tau = N-1;
epsilon = 0.1;
t_cut = tau * (0.5 - epsilon);
T_in = abs(k - 0.5 * tau);
z_exp = ((t_cut - 0.5 * tau) ./ (T_in - t_cut) + (t_cut - 0.5 * tau) ./ (T_in - 0.5 * tau));
sigma = (T_in < 0.5 * tau) ./ (exp(z_exp) + 1);
w = 1 * (T_in <= t_cut) + sigma .* (T_in > t_cut);
plotWindow(w, "Planck-taper", "epsilon = 0.1")
w = 0.35875 - 0.48829*cos(2*pi*k/(N-1)) + 0.14128*cos(4*pi*k/(N-1)) -0.01168*cos(6*pi*k/(N-1));
plotWindow(w, "Blackman-Harris")
w = 0.3635819 - 0.4891775*cos(2*pi*k/(N-1)) + 0.1365995*cos(4*pi*k/(N-1)) -0.0106411*cos(6*pi*k/(N-1));
plotWindow(w, "Blackman-Nuttall")
w = 1 - 1.93*cos(2*pi*k/(N-1)) + 1.29*cos(4*pi*k/(N-1)) -0.388*cos(6*pi*k/(N-1)) +0.032*cos(8*pi*k/(N-1));
plotWindow(w, "Flat top")
tau = (N/2);
w = exp(-abs(k-(N-1)/2)/tau);
plotWindow(w, "Exponential", "tau = N/2", "half window decay")
tau = (N/2)/(60/8.69);
w = exp(-abs(k-(N-1)/2)/tau);
plotWindow(w, "Exponential", "tau = (N/2)/(60/8.69)", "60dB decay")
alpha = 2;
w = 1/2*(1 - cos(2*pi*k/(N-1))).*exp(alpha*abs(N-2*k-1)/(1-N));
plotWindow(w, "Hann-Poisson", "alpha = 2")
| |||
| ソースコード | Octave
|


.png?uselang=ja)
.png?uselang=ja)
.png?uselang=ja&action=history)
.png)
.png)
.png)
.png)
.png)
.png)
.png)
.png)
.png)
.png)
.png)
.png)
.png)
.png)
.png)
.png)
.png)
.png)
.png)
.png)
.png)
ファイルの履歴
過去の版のファイルを表示するには、その版の日時をクリックしてください。
| 日付と時刻 | サムネイル | 寸法 | 利用者 | コメント | |
|---|---|---|---|---|---|
| 現在の版 | 2013年2月9日 (土) 16:48 | | 2,500 × 1,123 (83キロバイト) | Olli Niemitalo | Antialiasing, layout changes, larger font |
| 2005年12月17日 (土) 21:07 | 1,038 × 419 (7キロバイト) | Tiaguito~commonswiki | file size. color source: http://en.wikipedia.org/wiki/Window_Function | ||
| 2005年12月17日 (土) 20:48 | 1,038 × 419 (8キロバイト) | Tiaguito~commonswiki | source: http://en.wikipedia.org/wiki/Window_Function author: http://en.wikipedia.org/wiki/User:Bob_K |
ファイルの使用状況
このファイルを使用しているページはありません。
グローバルなファイル使用状況
以下に挙げる他のウィキがこの画像を使っています:
- da.wikipedia.org での使用状況
- et.wikipedia.org での使用状況
.png)