
ファイル:U.S. GDP - Real vs. Potential Per CBO Forecasts of 2007 and 2016.png
このプレビューのサイズ: 800 × 365 ピクセル。 その他の解像度: 320 × 146 ピクセル | 1,005 × 459 ピクセル。
元のファイル (1,005 × 459 ピクセル、ファイルサイズ: 21キロバイト、MIME タイプ: image/png)
ウィキメディア・コモンズのファイルページにある説明を、以下に表示します。
|
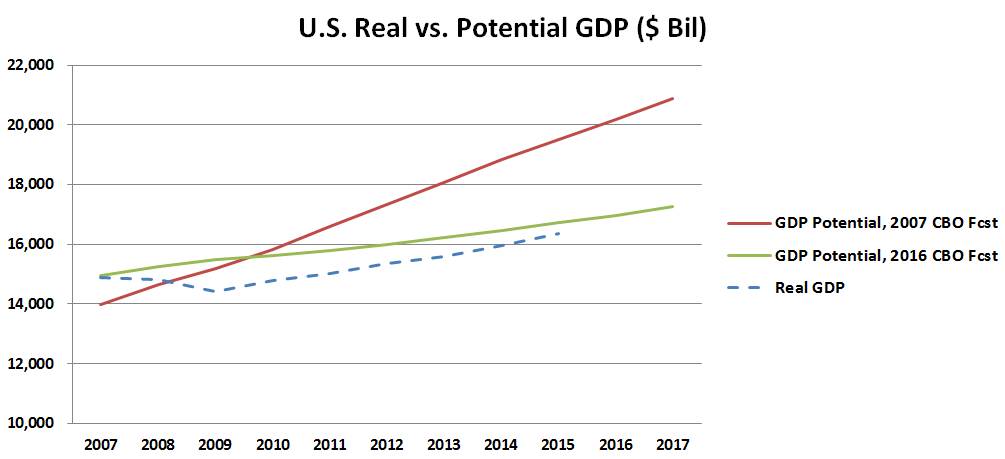
Understanding the chart
The chart compares two CBO projections of real potential GDP (the GDP amount the economy could theoretically produce at full employment) with actual real GDP. It shows how the Great Recession of 2007-2009 has impacted the trajectory. It is an updated version of a chart first presented by economist Lawrence Summers in February 2014 [1] and was more recently updated in a New York Times article by Neil Irwin in August, 2016.[2]
概要
| 解説 |
English: This chart compares U.S. potential GDP under two CBO forecasts (one from 2007 and one from 2016) versus the actual real GDP. It is based on a similar diagram from economist Larry Summers from 2014. |
| 日付 | |
| 原典 | 投稿者自身による著作物 |
| 作者 | Farcaster |
References
ライセンス
この作品の著作権者である私は、この作品を以下のライセンスで提供します。
このファイルはクリエイティブ・コモンズ 表示-継承 4.0 国際ライセンスのもとに利用を許諾されています。
- あなたは以下の条件に従う場合に限り、自由に
- 共有 – 本作品を複製、頒布、展示、実演できます。
- 再構成 – 二次的著作物を作成できます。
- あなたの従うべき条件は以下の通りです。
- 表示 – あなたは適切なクレジットを表示し、ライセンスへのリンクを提供し、変更があったらその旨を示さなければなりません。これらは合理的であればどのような方法で行っても構いませんが、許諾者があなたやあなたの利用行為を支持していると示唆するような方法は除きます。
- 継承 – もしあなたがこの作品をリミックスしたり、改変したり、加工した場合には、あなたはあなたの貢献部分を元の作品とこれと同一または互換性があるライセンスの下に頒布しなければなりません。
ファイルの履歴
過去の版のファイルを表示するには、その版の日時をクリックしてください。
| 日付と時刻 | サムネイル | 寸法 | 利用者 | コメント | |
|---|---|---|---|---|---|
| 現在の版 | 2016年7月21日 (木) 02:26 | | 1,005 × 459 (21キロバイト) | Farcaster | User created page with UploadWizard |
ファイルの使用状況
以下のページがこのファイルを使用しています:
グローバルなファイル使用状況
以下に挙げる他のウィキがこの画像を使っています:
- en.wikipedia.org での使用状況
- es.wikipedia.org での使用状況
- he.wikipedia.org での使用状況
- ru.wikipedia.org での使用状況