
ファイル:Subprime Crisis Diagram - X1.png

元のファイル (960 × 720 ピクセル、ファイルサイズ: 17キロバイト、MIME タイプ: image/png)
ウィキメディア・コモンズのファイルページにある説明を、以下に表示します。
|
概要
| 解説 |
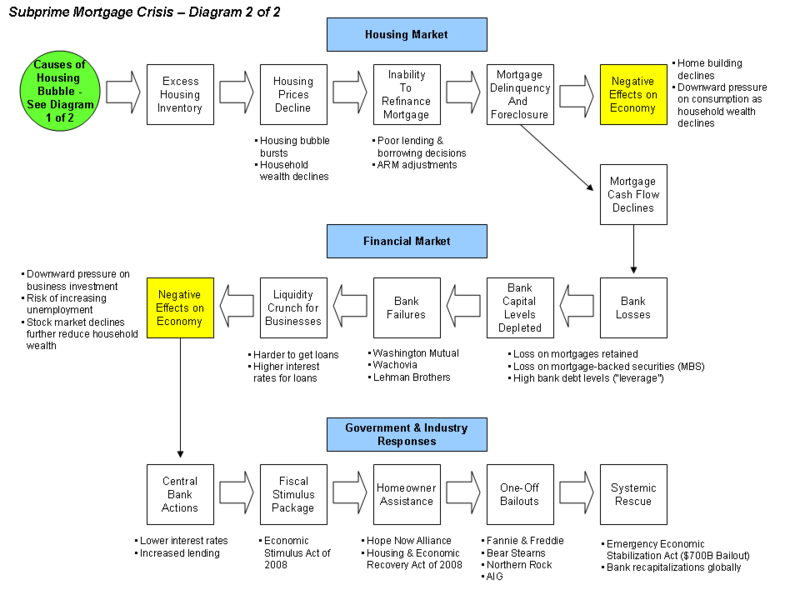
English: Diagram of the Subprime Mortgage Crisis SourcesThe many sources supporting this diagram are those used for the 2007 Subprime mortgage financial crisis and the linked articles below. Hopefully, this helps you visualize the elements. There is no substitute for reading the article first. This diagram is intended to illustrate how declines in the housing market transfer through the mortgage-backed securities to the financial markets, damaging the banks and economy along the way. Text Explanation of the DiagramThe ripple or domino effect was summarized in plain language by President Bush in his address to the Nation on September 24, 2008.[1]
Other Information
Caveats
SourcesThe letters from Fed Chairman Bernanke provide a helpful explanation of the subject.[6] [7] Further, several cover stories and in-depth articles appeared in the Economist[8] [9] [10] and Business Week.[11] Former Federal Reserve Chairman Greenspan wrote an Op Ed piece for the Wall Street Journal that summarizes the crisis from a variety of angles.[12] Economist Joseph Stiglitz summarized his views on the causes of the crisis.[13] Image of the Housing BubbleThis diagram can be better understood in the context of the housing bubble. The subprime mortgage crisis followed the bursting of the United states housing bubble. thumb|Building of the Housing Bubble ReferencesライセンスThis is the original. Do not delete. |
| 日付 | |
| 原典 | 投稿者自身による著作物 (Original text: I created this work entirely by myself.) |
| 作者 | Farcaster (talk) 05:18, 10 October 2008 (UTC) |
ライセンス
- ↑ President's Address to the Nation
- ↑ The Wall Street Journal Online - Featured Article
- ↑ Krugman - NYT
- ↑ Krugman - NYT - Gordon does Good
- ↑ Time Magazine - Lessons from Japan & Asia
- ↑ FRB: Speech-Bernanke, Financial Markets, the Economic Outlook, and Monetary Policy -January 10, 2008
- ↑ FRB: Speech-Bernanke, The Recent Financial Turmoil and its Economic and Policy Consequences-October 15, 2007
- ↑ The credit crunch | Postcards from the ledge | Economist.com]
- ↑ CSI: credit crunch | Economist.com]
- ↑ America's economy | Getting worried downtown | Economist.com]
- ↑ Housing Meltdown
- ↑ The Wall Street Journal Online - Featured Article
- ↑ Stiglitz-Vanity Fair
- あなたは以下の条件に従う場合に限り、自由に
- 共有 – 本作品を複製、頒布、展示、実演できます。
- 再構成 – 二次的著作物を作成できます。
- あなたの従うべき条件は以下の通りです。
- 表示 – あなたは適切なクレジットを表示し、ライセンスへのリンクを提供し、変更があったらその旨を示さなければなりません。これらは合理的であればどのような方法で行っても構いませんが、許諾者があなたやあなたの利用行為を支持していると示唆するような方法は除きます。
- 継承 – もしあなたがこの作品をリミックスしたり、改変したり、加工した場合には、あなたはあなたの貢献部分を元の作品とこれと同一または互換性があるライセンスの下に頒布しなければなりません。

|
この文書は、フリーソフトウェア財団発行のGNUフリー文書利用許諾書 (GNU Free Documentation License) 1.2またはそれ以降のバージョンの規約に基づき、複製や再配布、改変が許可されます。不可変更部分、表紙、背表紙はありません。このライセンスの複製は、GNUフリー文書利用許諾書という章に含まれています。 |
元のアップロードログ
- 2008-10-21 02:40 Farcaster 960×720× (17754 bytes)
- 2008-10-10 06:59 Farcaster 960×720× (16556 bytes)
- 2008-10-10 05:44 Farcaster 960×720× (16328 bytes)
- 2008-10-10 05:30 Farcaster 960×720× (15892 bytes)
- 2008-10-10 05:18 Farcaster 960×720× (15896 bytes) {{Information |Description=Diagram of the Subprime Mortgage Crisis |Source=I created this work entirely by myself. |Date=October 10, 2008 |Author=~~~~ |other_versions= }}
ファイルの履歴
過去の版のファイルを表示するには、その版の日時をクリックしてください。
| 日付と時刻 | サムネイル | 寸法 | 利用者 | コメント | |
|---|---|---|---|---|---|
| 現在の版 | 2010年10月14日 (木) 00:47 | | 960 × 720 (17キロバイト) | Hideokun | {{Information |Description={{en|Diagram of the Subprime Mortgage Crisis<br/> ==Sources== The many sources supporting this diagram are those used for the en:2007 Subprime mortgage financial crisis and the linked articles below. Hopefully, this helps |
ファイルの使用状況
以下の 2 ページがこのファイルを使用しています:
グローバルなファイル使用状況
以下に挙げる他のウィキがこの画像を使っています:
- fr.wikipedia.org での使用状況
- hi.wikipedia.org での使用状況
- it.wikipedia.org での使用状況
- kk.wikipedia.org での使用状況
- kn.wikipedia.org での使用状況
- ru.wikipedia.org での使用状況
- ta.wikipedia.org での使用状況
- www.wikidata.org での使用状況