ファイル:Scatter plot.jpg
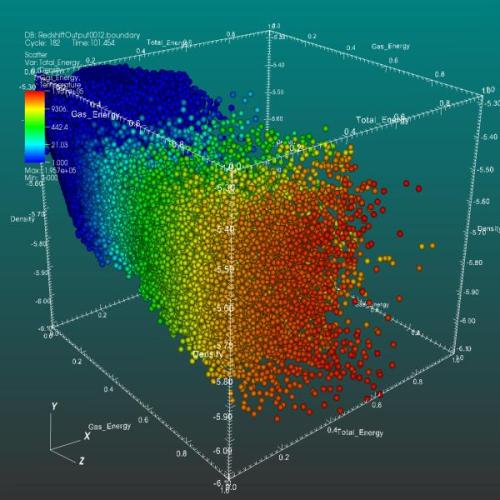
Scatter_plot.jpg (500 × 500 ピクセル、ファイルサイズ: 40キロバイト、MIME タイプ: image/jpeg)
ファイルの履歴
過去の版のファイルを表示するには、その版の日時をクリックしてください。
| 日付と時刻 | サムネイル | 寸法 | 利用者 | コメント | |
|---|---|---|---|---|---|
| 現在の版 | 2008年7月10日 (木) 22:34 |  | 500 × 500 (40キロバイト) | Mdd | {{Information |Description={{en|1=Scatter plot VisIt's Scatter plot allows you to visualize multivariate data of up to four dimensions. The Scatter plot takes multiple scalar variables and uses them for different axes in phase space. The different variab |
ファイルの使用状況
グローバルなファイル使用状況
以下に挙げる他のウィキがこの画像を使っています:
- ar.wikipedia.org での使用状況
- bn.wikipedia.org での使用状況
- ca.wikipedia.org での使用状況
- de.wikipedia.org での使用状況
- en.wikipedia.org での使用状況
- en.wikiversity.org での使用状況
- et.wikipedia.org での使用状況
- eu.wikipedia.org での使用状況
- fa.wikipedia.org での使用状況
- gl.wikipedia.org での使用状況
- id.wikipedia.org での使用状況
- it.wikipedia.org での使用状況
- pt.wikipedia.org での使用状況
- ro.wikipedia.org での使用状況
- ru.wikipedia.org での使用状況
- simple.wikipedia.org での使用状況
- sl.wikipedia.org での使用状況
- sr.wikipedia.org での使用状況
- sv.wikipedia.org での使用状況
- uk.wikipedia.org での使用状況
- zh.wikipedia.org での使用状況


