
ファイル:Radiocarbon bomb spike.svg

この SVG ファイルのこの PNG プレビューのサイズ: 600 × 480 ピクセル. その他の解像度: 300 × 240 ピクセル | 960 × 768 ピクセル | 1,280 × 1,024 ピクセル | 2,560 × 2,048 ピクセル。
元のファイル (SVG ファイル、600 × 480 ピクセル、ファイルサイズ: 27キロバイト)
ウィキメディア・コモンズのファイルページにある説明を、以下に表示します。
|
| 解説 |
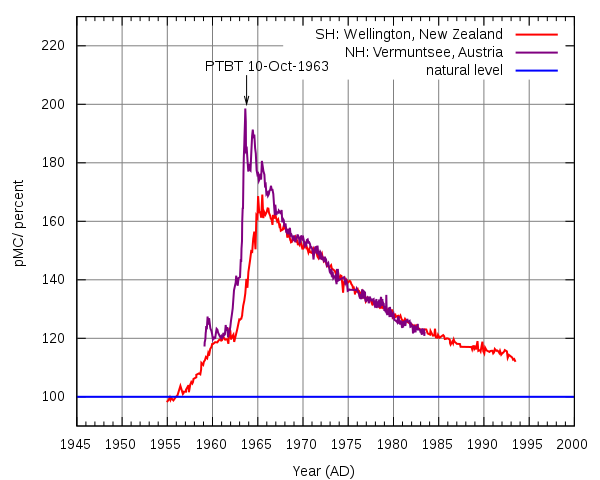
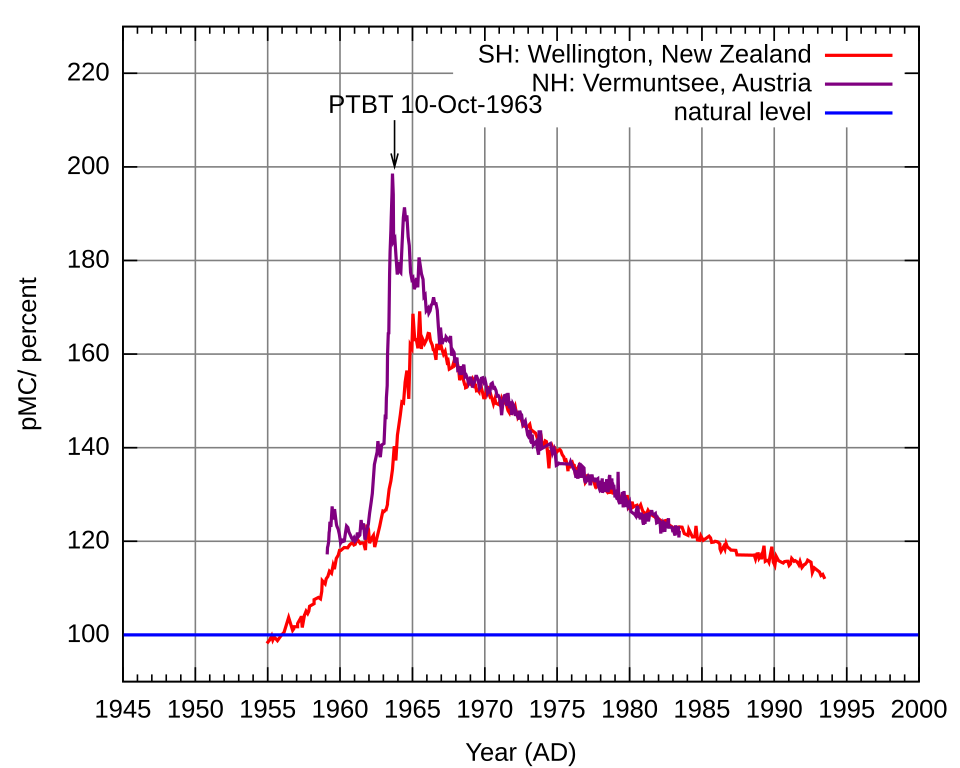
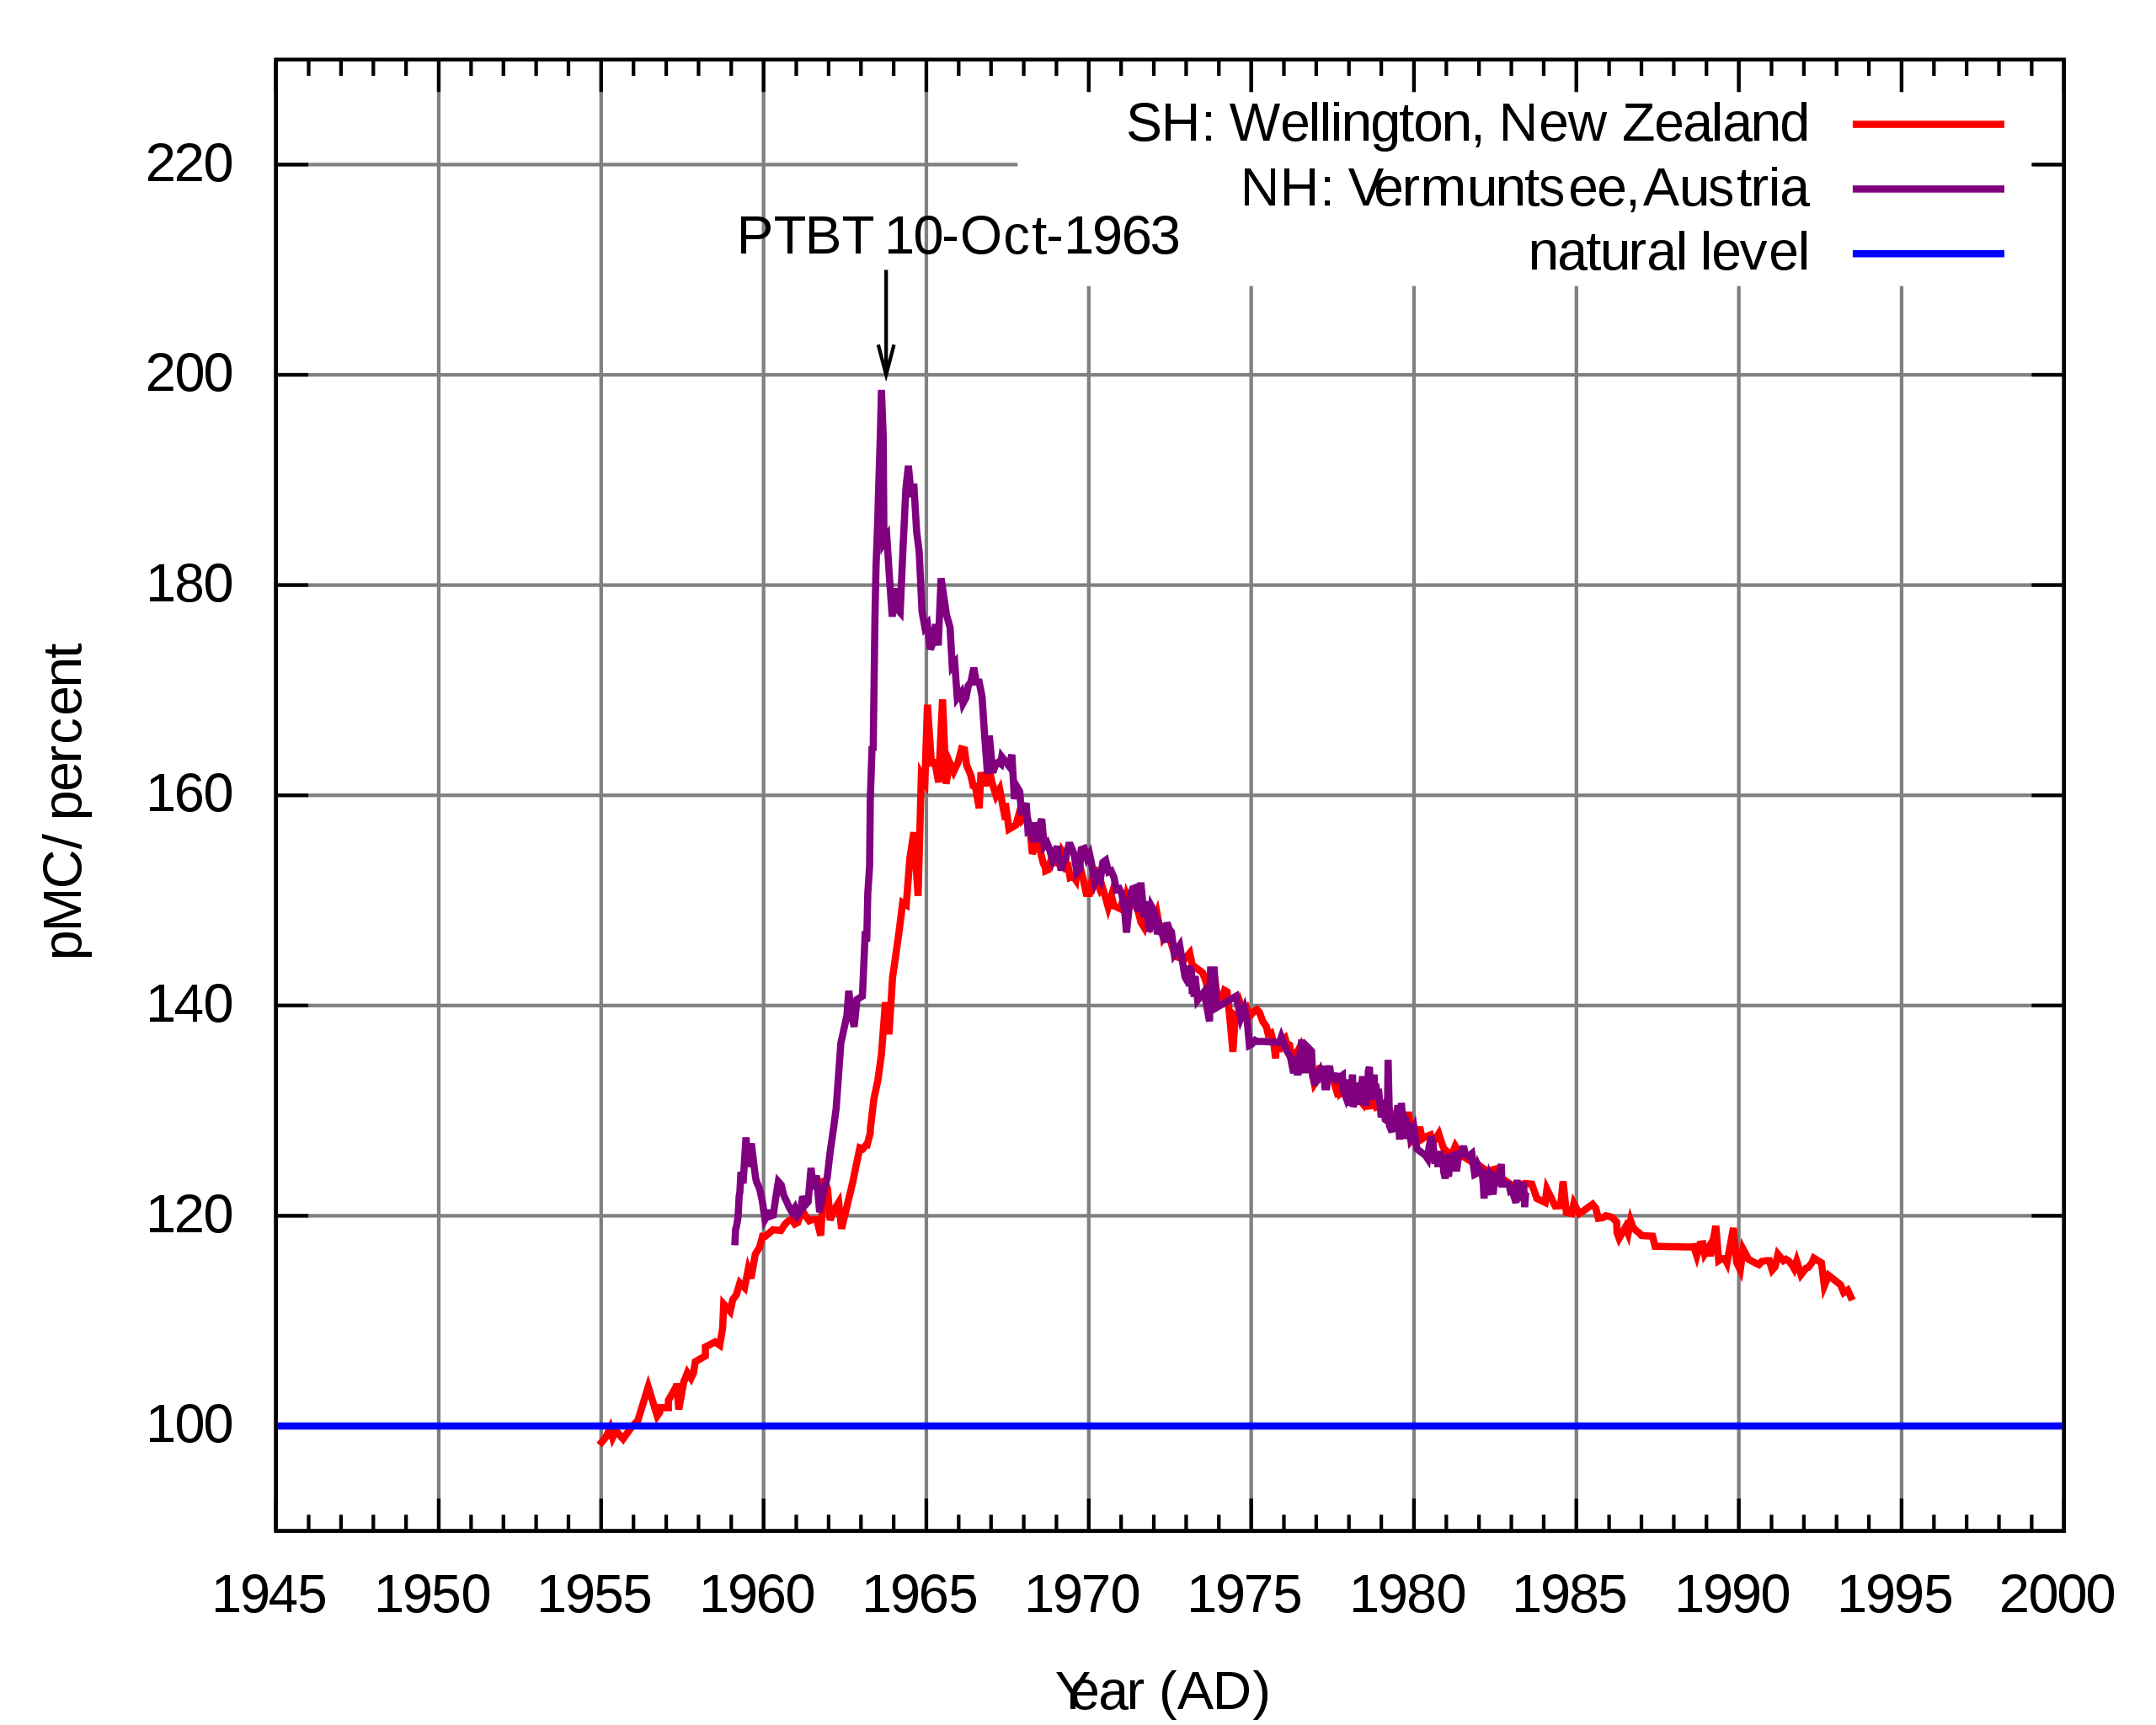
English: Atmospheric 14CO2 in the second half of the 20th century.
The figure shows the 14C / 12C ratio relative to the natural level in the atmospheric CO2 as a function of time in the second half of the 20th century. The plot was generated with gnuplot from data of atmospheric radiocarbon in Wellington, New Zealand 1954AD to 1993AD and at the Vermuntsee, Austria 1959AD to 1983AD. The SVG file from gnuplot has been improved manually. The data sources provide the data as D14C. For the plot the absolute percent modern value has been calculated assuming that each measurement was done in the same year as the respective sample was taken.Deutsch: Atmosphärisches 14CO2 in der zweiten Hälfte des 20. Jahrhunderts. |
||
| 日付 | AD 2008-08-09 | ||
| 原典 |
投稿者自身による著作物 (Original text: Own work. Data from the following sources:)
|
||
| 作者 | Hokanomono | ||
| 許可 (ファイルの再利用) |
All rights for generating the graphics shall be released. As far as I know there is no copyright protection on measurement data in general.
|
||
| その他のバージョン |
|
||
| SVG 開発 | |||
| ソースコード | Gnuplot codereset
set term svg enhanced
set output "plot.svg"
set xdata time
set timefmt "%Y-%m-%d"
set xrange ["1945-1-1":"2000-1-1"]
set format x "%Y"
set xtics 5*31556926
set grid
#set title 'Atmospheric ^{14}CO_{2}'
set xlabel 'Year (AD)'
set ylabel 'pMC/ percent'
#see Stuiver Polach for conversion between D14C and pMC
lambda = 1.0 / (8267 * 365.2422 * 24 * 3600)
set arrow from "1963-10-10", 210 to "1963-10-10", 200
set label "PTBT 10-Oct-1963" at "1963-10-10", 210 offset -5,0.5
plot [][90:230] "<awk '!/*/{print \"19\" $1 \"-\" $2 \"-\" $3, mktime(sprintf(\"19%02i %02i %02i 00 00 00\", $1, $2, $3)) - mktime(\"1950 01 01 00 00 00\"), $6, $7;}' welling.195" us 1:(($3+1000)*exp(-lambda*$2)*0.1) tit 'SH: Wellington, New Zealand' w lines, "<awk 'BEGIN{FIELDWIDTHS=\"1 7 5 7 5 2 3 3 4 2 3 3 5 6 5 4 3 2 1\";} /^ HD-/{a = mktime(sprintf(\"19%02i %02i %02i 00 00 00\", $8, $7, $6)); b = mktime(sprintf(\"19%02i %02i %02i 00 00 00\", $12, $11, $10)); present=mktime(\"1950 01 01 00 00 00\"); printf \"%s %g %4g %2g\\n\", strftime(\"%Y-%m-%d\", (a+b)/2), (b-a)/2, b-present, $16, $18;}' vermunt.c14" us 1:(($4+1000)*exp(-lambda*$3)*0.1) tit 'NH: Vermunt, Austria' w lines, 100 tit 'natural level'
set output
|

ファイルの履歴
過去の版のファイルを表示するには、その版の日時をクリックしてください。
| 日付と時刻 | サムネイル | 寸法 | 利用者 | コメント | |
|---|---|---|---|---|---|
| 現在の版 | 2015年4月10日 (金) 14:32 | | 600 × 480 (27キロバイト) | Hokanomono | Increase line width. |
| 2015年4月9日 (木) 08:43 |  | 600 × 480 (27キロバイト) | Hokanomono | Change green line to purple. | |
| 2011年4月5日 (火) 20:09 |  | 600 × 480 (27キロバイト) | Hokanomono | Changed “Vermunt” to “Vermuntsee”. | |
| 2008年8月9日 (土) 13:30 |  | 600 × 480 (27キロバイト) | Hokanomono | {{Information |Description= |Source= |Date= |Author= |Permission= |other_versions= }} | |
| 2006年3月14日 (火) 22:27 |  | 600 × 480 (21キロバイト) | Hokanomono | This is a new version of Media:Atmospheric radiocarbon 1954-1993.svg. I have changed the title because I'm using additional data sources now. |
ファイルの使用状況
以下のページがこのファイルを使用しています:
グローバルなファイル使用状況
以下に挙げる他のウィキがこの画像を使っています:
- be.wikipedia.org での使用状況
- bg.wikipedia.org での使用状況
- ca.wikipedia.org での使用状況
- cs.wikipedia.org での使用状況
- cv.wikipedia.org での使用状況
- da.wikipedia.org での使用状況
- de.wikipedia.org での使用状況
- Radiokarbonmethode
- Kernwaffen-Effekt
- Vertrag über das Verbot von Kernwaffenversuchen in der Atmosphäre, im Weltraum und unter Wasser
- Portal:Chemie/Übersicht Lesenswerte Artikel
- Portal:Chemie/Artikelauszug/Radiokohlenstoffdatierung
- Diskussion:Radiokarbonmethode/Archiv/1
- Salted Bomb
- Portal:Physik/Artikel des Monats 2018-09
- Wikipedia Diskussion:Hauptseite/Artikel des Tages/Archiv/Vorschläge/2021/Q4
- Wikipedia:Hauptseite/Archiv/26. Dezember 2021
- en.wikipedia.org での使用状況
- Background radiation
- Partial Nuclear Test Ban Treaty
- Nuclear fallout
- Carbon-14
- Radioactive contamination
- User talk:Hokanomono
- Wikipedia:Reference desk/Archives/Science/2009 January 3
- User:Boundarylayer/sandbox
- Bomb pulse
- Wikipedia:WikiProject Wikipack Africa Content/Wikipedia:Showcase
- Wikipedia:WikiProject WikiFundi Content/Radiocarbon dating
- Wikipedia:WikiProject WikiFundi Content/Wikipedia:Showcase
- eo.wikipedia.org での使用状況
- es.wikipedia.org での使用状況
- et.wikipedia.org での使用状況
- fr.wikipedia.org での使用状況
- he.wikipedia.org での使用状況
- hi.wikipedia.org での使用状況
- hr.wikipedia.org での使用状況
- hu.wikipedia.org での使用状況
- hy.wikipedia.org での使用状況
- it.wikipedia.org での使用状況
このファイルのグローバル使用状況を表示する。