
ファイル:Price elasticity of demand and revenue.svg

この SVG ファイルのこの PNG プレビューのサイズ: 215 × 320 ピクセル. その他の解像度: 161 × 240 ピクセル | 322 × 480 ピクセル | 516 × 768 ピクセル | 688 × 1,024 ピクセル | 1,376 × 2,048 ピクセル。
元のファイル (SVG ファイル、215 × 320 ピクセル、ファイルサイズ: 9キロバイト)
ウィキメディア・コモンズのファイルページにある説明を、以下に表示します。
|
| 解説 |
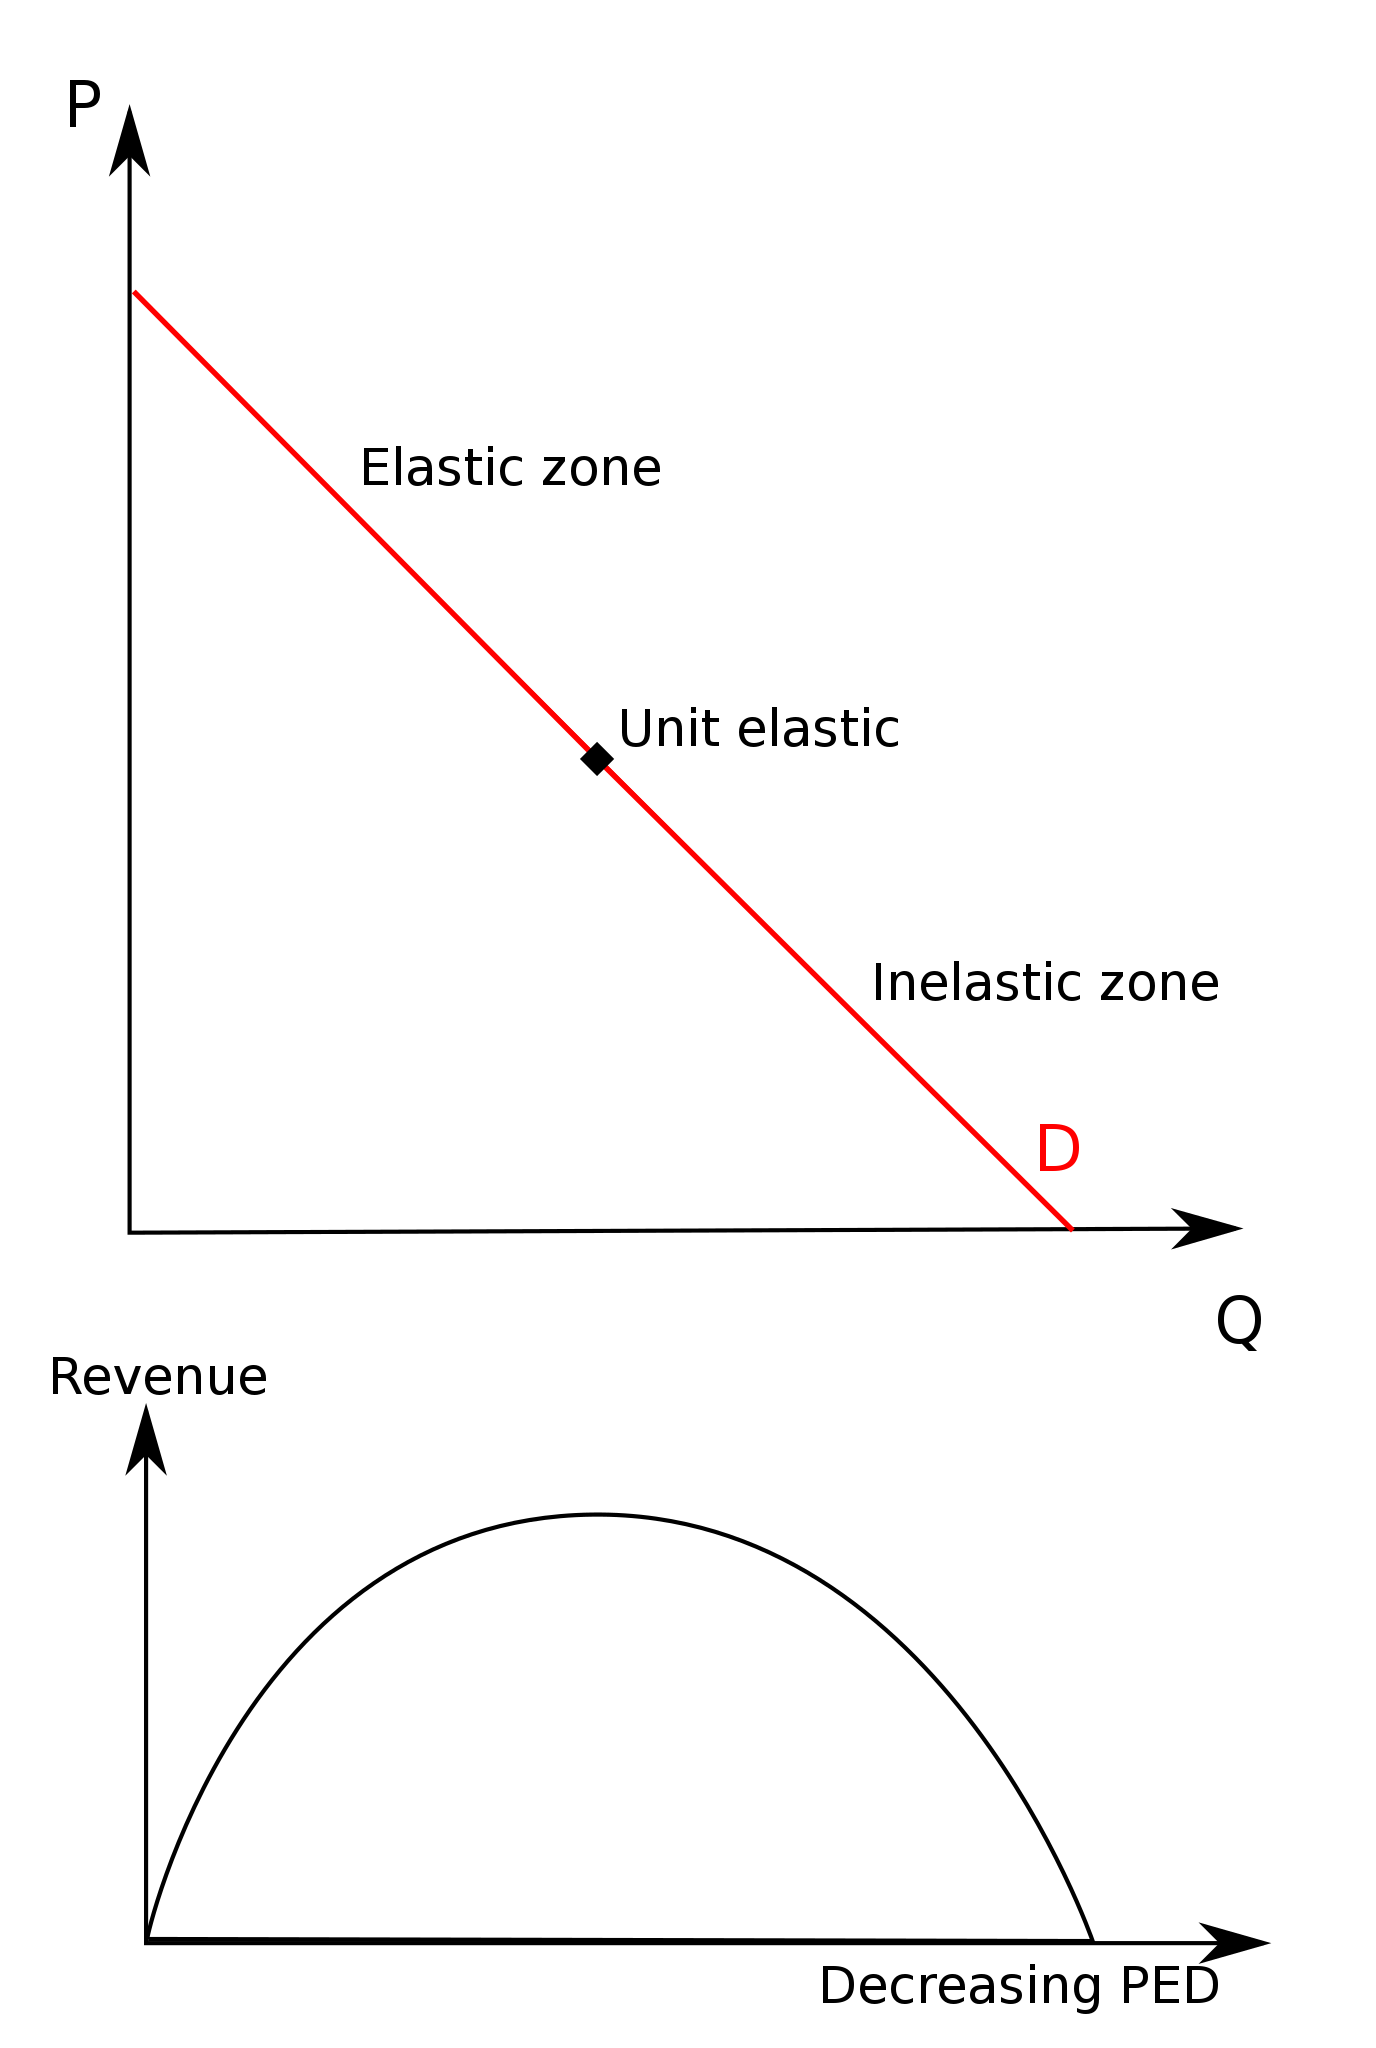
English: An SVG-ified graph showing the relationship between elasticity and revenue. Such graphs are common when explaining this relationship; for an interactive Java applet demonstrating the concept, see [1]. A chart showing total revenue (but not an associated demand curve) is also available in Pashigian, Peter B. (1998). Price Theory and Applications. McGraw-Hill. ISBN 0070487782. Note: not as strictly accurate as original file. |
| 日付 | (UTC) |
| 原典 | |
| 作者 |
|
この作品の著作権者である私は、この作品を以下のライセンスで提供します。
| このファイルはクリエイティブ・コモンズ 表示-継承 3.0 非移植ライセンスのもとに利用を許諾されています。 著作権に示した解釈の下ライセンスされるものとします。 | ||
| ||
| このライセンスのテンプレートは、GFDLのライセンス・アップデートによりこのファイルに追加されたものです。 |

|
この文書は、フリーソフトウェア財団発行のGNUフリー文書利用許諾書 (GNU Free Documentation License) 1.2またはそれ以降のバージョンの規約に基づき、複製や再配布、改変が許可されます。不可変更部分、表紙、背表紙はありません。このライセンスの複製は、GNUフリー文書利用許諾書という章に含まれています。 著作権に示した解釈の下ライセンスされるものとします。 |
あなたは上記のライセンスから、どれか一つ以上を選択できます。
元のアップロードログ
This image is a derivative work of the following images:
- File:Price_elasticity_of_demand_and_revenue.png licensed with Cc-by-sa-3.0-migrated, Cc-by-sa-3.0-migrated-with-disclaimers, GFDL, GFDL-en
- 2010-02-28T15:06:27Z File Upload Bot (Magnus Manske) 430x505 (7871 Bytes) {{BotMoveToCommons|en.wikipedia|year={{subst:CURRENTYEAR}}|month={{subst:CURRENTMONTHNAME}}|day={{subst:CURRENTDAY}}}} {{Information |Description={{en|A graph showing the relationship between elasticity and revenue. Made by
Uploaded with derivativeFX
ファイルの履歴
過去の版のファイルを表示するには、その版の日時をクリックしてください。
| 日付と時刻 | サムネイル | 寸法 | 利用者 | コメント | |
|---|---|---|---|---|---|
| 現在の版 | 2010年2月28日 (日) 15:22 | | 215 × 320 (9キロバイト) | Jarry1250 | Sorry, uploaded wrong version. This one has the correct labels. |
| 2010年2月28日 (日) 15:14 |  | 215 × 320 (7キロバイト) | Jarry1250 | {{Information |Description={{en|An SVG-ified graph showing the relationship between elasticity and revenue. Such graphs are common when explaining this relationship; for an interactive Java applet demonstrating the concept, see [http://www.econtools.com/j |
ファイルの使用状況
以下のページがこのファイルを使用しています:
グローバルなファイル使用状況
以下に挙げる他のウィキがこの画像を使っています:
- de.wikipedia.org での使用状況
- en.wikipedia.org での使用状況
- es.wikipedia.org での使用状況
- pt.wikibooks.org での使用状況
- pt.wikiversity.org での使用状況
- si.wikipedia.org での使用状況
- uk.wikipedia.org での使用状況
- uz.wikipedia.org での使用状況