
ファイル:Mpl screenshot figures and code.png

このプレビューのサイズ: 752 × 599 ピクセル。 その他の解像度: 301 × 240 ピクセル | 602 × 480 ピクセル | 964 × 768 ピクセル | 1,227 × 978 ピクセル。
元のファイル (1,227 × 978 ピクセル、ファイルサイズ: 350キロバイト、MIME タイプ: image/png)
ウィキメディア・コモンズのファイルページにある説明を、以下に表示します。
|
概要
| 解説 |
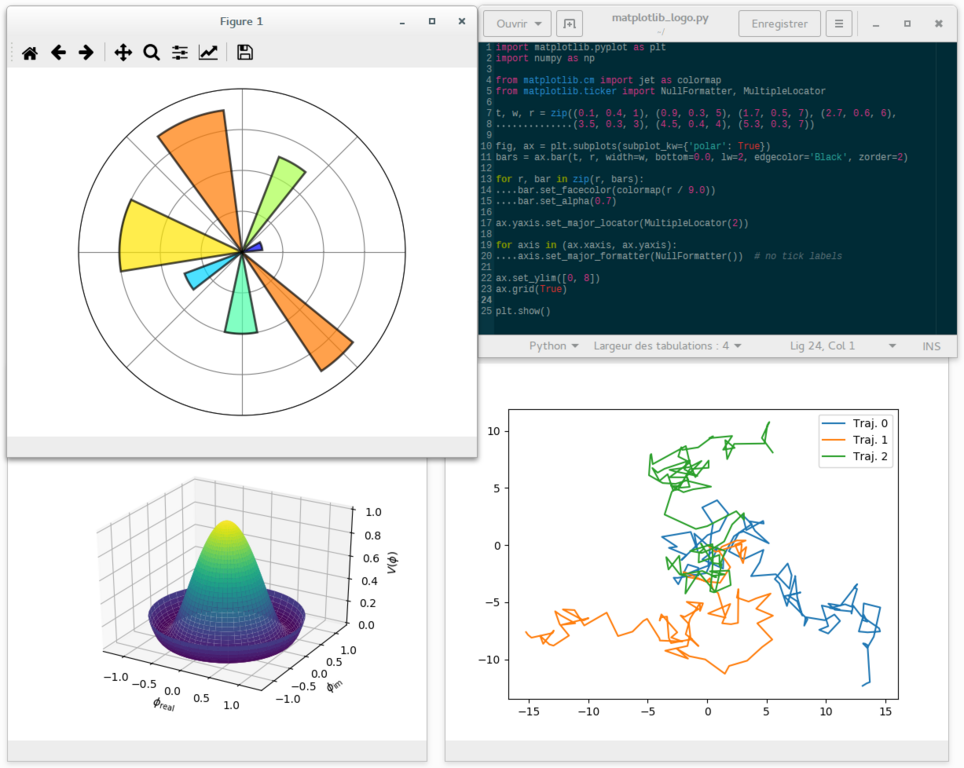
English: A screenshot showing matplotlib plots of a polar bar graph resembling the matplotlib logo (upper left), a 3D surface graph with the new default 'viridis' colormap (lower left), a graph of 2D random walk trajectories (lower right), and the python source code (of the logo part) opened in a text editor (upper right). |
| 日付 | |
| 原典 | 投稿者自身による著作物 |
| 作者 | Adrien F. Vincent |
Rationale: this work aims at providing an up-to-date version of the previous work https://en.wikipedia.org/wiki/File:Matplotlib_screenshot.png , done by Geek3.
The matplotlib (mpl) version is the development branch 2.x, with Python 2.7.11 and numpy 1.11.1
##########
## Code for the mpl logo figure
##########
import matplotlib.pyplot as plt
import numpy as np

from matplotlib.cm import jet as colormap
from matplotlib.ticker import NullFormatter, MultipleLocator

t, w, r = zip((0.1, 0.4, 1), (0.9, 0.3, 5), (1.7, 0.5, 7), (2.7, 0.6, 6),
              (3.5, 0.3, 3), (4.5, 0.4, 4), (5.3, 0.3, 7))

fig, ax = plt.subplots(subplot_kw={'polar': True})
bars = ax.bar(t, r, width=w, bottom=0.0, lw=2, edgecolor='Black', zorder=2)

for r, bar in zip(r, bars):
    bar.set_facecolor(colormap(r / 9.0))
    bar.set_alpha(0.7)

ax.yaxis.set_major_locator(MultipleLocator(2))

for axis in (ax.xaxis, ax.yaxis):
    axis.set_major_formatter(NullFormatter())  # no tick labels

ax.set_ylim([0, 8])
ax.grid(True)

plt.show()
####################
##########
## Code for the 3D surface plot and the 2D random walk tajectories
##########
import matplotlib.pyplot as plt
import numpy as np

from mpl_toolkits.mplot3d import Axes3D
from matplotlib.cm import viridis as colormap

"""
Figure 1: a 3D surface plot (from matplotlib gallery)
"""
step = 0.04
maxval = 1.0
fig1 = plt.figure("Figure_1")
ax1 = fig1.add_subplot(111, projection='3d')

# Create supporting points in polar coordinates
r = np.linspace(0, 1.2, 50)
p = np.linspace(0, 2*np.pi, 50)
R, P = np.meshgrid(r, p)
# Transform them to cartesian system
X, Y = R*np.cos(P), R*np.sin(P)

Z = ((R**2 - 1)**2)
ax1.plot_surface(X, Y, Z, rstride=1, cstride=1, cmap=colormap)
ax1.set_zlim3d(0, 1)
ax1.set_xlabel(r'$\phi_\mathrm{real}$')
ax1.set_ylabel(r'$\phi_\mathrm{im}$')
ax1.set_zlabel(r'$V(\phi)$')

"""
Figure 2: a few examples of 2D random walk
"""
fig2, ax2 = plt.subplots(num="Figure_2")

prng = np.random.RandomState(123)

x = np.linspace(0, 10, 101)

def random_walk(xy0=(0.0, 0.0), nsteps=100, std=1.0):
    xy = np.zeros((nsteps + 1, 2))
    xy[0,:] = xy0
    deltas = prng.normal(loc=0.0, scale=std, size=(nsteps, 2))
    xy[1:, :] = xy[0, :] + np.cumsum(deltas, axis=0)
    return xy

for cnt in range(3):
    traj = random_walk()
    ax2.plot(traj[:, 0], traj[:, 1], label="Traj. {c}".format(c=cnt))

ax2.legend(loc='best')

plt.show()
####################
ライセンス
この作品の著作権者である私は、この作品を以下のライセンスで提供します。
このファイルはクリエイティブ・コモンズ 表示-継承 4.0 国際ライセンスのもとに利用を許諾されています。
- あなたは以下の条件に従う場合に限り、自由に
- 共有 – 本作品を複製、頒布、展示、実演できます。
- 再構成 – 二次的著作物を作成できます。
- あなたの従うべき条件は以下の通りです。
- 表示 – あなたは適切なクレジットを表示し、ライセンスへのリンクを提供し、変更があったらその旨を示さなければなりません。これらは合理的であればどのような方法で行っても構いませんが、許諾者があなたやあなたの利用行為を支持していると示唆するような方法は除きます。
- 継承 – もしあなたがこの作品をリミックスしたり、改変したり、加工した場合には、あなたはあなたの貢献部分を元の作品とこれと同一または互換性があるライセンスの下に頒布しなければなりません。
ファイルの履歴
過去の版のファイルを表示するには、その版の日時をクリックしてください。
| 日付と時刻 | サムネイル | 寸法 | 利用者 | コメント | |
|---|---|---|---|---|---|
| 現在の版 | 2016年9月27日 (火) 09:52 | | 1,227 × 978 (350キロバイト) | Adrien F. Vincent | User created page with UploadWizard |
ファイルの使用状況
以下のページがこのファイルを使用しています:
グローバルなファイル使用状況
以下に挙げる他のウィキがこの画像を使っています:
- bn.wikipedia.org での使用状況
- en.wikipedia.org での使用状況
- fr.wikipedia.org での使用状況
- hu.wikipedia.org での使用状況
- ko.wikipedia.org での使用状況
- pl.wikipedia.org での使用状況
- pt.wikipedia.org での使用状況
- sr.wikipedia.org での使用状況
- tr.wikipedia.org での使用状況
- zh.wikipedia.org での使用状況