ファイル:Climate Change Attribution.png

ページのコンテンツが他言語でサポートされていません。

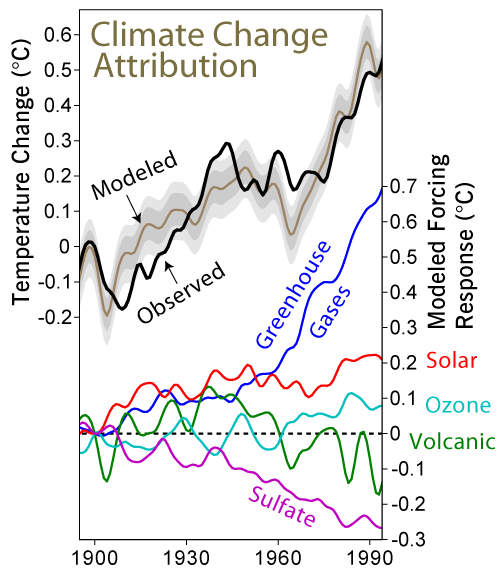
Climate_Change_Attribution.png(500 × 573 ピクセル、ファイルサイズ: 28キロバイト、MIME タイプ: image/png)

概要

解説
English: See extending Description below
原典 This figure was created by Robert A. Rohde from published data
作者 Robert A. Rohde
その他のバージョン other language versions mostly beginng with "File:Climate Change... "
このグラフ画像は、ベクターイメージである SVG ファイルとして再作成されるべきです。これにはいくつかの利点があります。詳しくはCommons:Media for cleanupを参照してください。この画像の SVG 形式がすでに利用可能である場合は、アップロードしてください。アップロード後、この画像にあるこのテンプレートを{{Vector version available|新しい画像ファイル名.svg}}テンプレートで置き換えてください。

概要

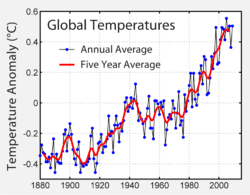
Instrumental temperature record of the last 150 years. This data is the same as the black curve in the figure.

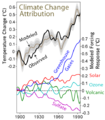
This figure, based on Meehl et al. (2004), shows how a global climate model (the DOE PCM [1]) is tuned to reconstruct the historical temperature record and the corresponding assumptions in the model to which the associated temperature changes can be decomposed into various forcing factors. The top part of the figure compares a five year average of global temperature measurements (Jones and Moberg 2001) to the Meehl et al. results incorporating the effects of five predetermined forcing factors: greenhouse gases, man-made sulfate emissions, solar variability, ozone changes (both stratospheric and tropospheric), and volcanic emissions (including natural sulfates). The time history and radiative forcing qualities for each of these factors was specified in advance and was not adjusted indvidually to specifically match the temperature record. The exception being the aerosol forcing which is based on expert´s judgement balancing the GHG forcing due to the inherent large uncertainty of the historical aerosol forcings.

Also shown are grey bands indicating the 68% and 95% range for natural variability in temperature relative to the climatic expectation as determined from multiple simulations with different initial conditions. In other words, they indicate the estimated size of variations that are expected to occur due to fluctuation in weather rather than changes in climate. Ideally the model should be able to reconstruct temperature variations to within about the tolerance specified by these bands. Some of the remaining misfit may be accounted for by the ~0.05 °C uncertainty in the temperature reconstruction. However, though the model captures the gross features of twentieth century climate change, it remains likely that some of the differences between model and observation still reflect the limitations of the model and/or our understanding of the histories of the observed forcing factors.

In the lower portion of the figure are the results of additional simulations in which the model was operated with only one forcing factor used at a time. A key conclusion of the Meehl et al. (2004) work is that the model response to all factors combined is to a good approximation equal to the sum of the responses to each factor taken individually. This means it is reasonable to talk about the temperature change due to individual aspects of the evolving man-made and natural influences on climate. The zeros on both plots are set equal to 1900 temperatures, and it is apparent that most of the 0.52 °C global warming between 1900 and 1994 should be attributed to a 0.69 °C temperature forcing from greenhouse gases partially offset by a 0.27 °C cooling due to man-made sulfate emissions and with other factors contributing the balance. This contrasts with the warming from 1900 to 1940 for which the model only attributes a net increases of 0.06 °C to the combined effects of greenhouse gases and sulfate emissions.

Temperature change relative to 1900
1940 1970 1994
Greenhouse gases 0.10 0.38 0.69
Sulfate emissions -0.04 -0.19 -0.27
Solar forcing 0.18 0.10 0.21
Volcanic forcing 0.11 -0.04 -0.14
Ozone -0.06 0.05 0.08
Net 0.19 0.17 0.53
Observed 0.26 0.21 0.52

Note that "Net" reflects the model runs with all factors included and is not identical to simply summing the individual factors.

References

ライセンス

This figure was created by Robert A. Rohde from published data and is incorporated into the Global Warming Art project.

Image from Global Warming Art
This image is an original work created for Global Warming Art. Please refer to the image description page for more information.
GNU head この文書は、フリーソフトウェア財団発行のGNUフリー文書利用許諾書 (GNU Free Documentation License) 1.2またはそれ以降のバージョンの規約に基づき、複製や再配布、改変が許可されます。不可変更部分、表紙、背表紙はありません。このライセンスの複製は、GNUフリー文書利用許諾書という章に含まれています。
w:ja:クリエイティブ・コモンズ
表示 継承
このファイルはクリエイティブ・コモンズ 表示-継承 3.0 非移植ライセンスのもとに利用を許諾されています。
あなたは以下の条件に従う場合に限り、自由に
  • 共有 – 本作品を複製、頒布、展示、実演できます。
  • 再構成 – 二次的著作物を作成できます。
あなたの従うべき条件は以下の通りです。
  • 表示 – あなたは適切なクレジットを表示し、ライセンスへのリンクを提供し、変更があったらその旨を示さなければなりません。これらは合理的であればどのような方法で行っても構いませんが、許諾者があなたやあなたの利用行為を支持していると示唆するような方法は除きます。
  • 継承 – もしあなたがこの作品をリミックスしたり、改変したり、加工した場合には、あなたはあなたの貢献部分を元の作品とこれと同一または互換性があるライセンスの下に頒布しなければなりません。
このライセンスのテンプレートは、GFDLのライセンス・アップデートによりこのファイルに追加されたものです。


このグラフ画像は、ベクターイメージである SVG ファイルとして再作成されるべきです。これにはいくつかの利点があります。詳しくはCommons:Media for cleanupを参照してください。この画像の SVG 形式がすでに利用可能である場合は、アップロードしてください。アップロード後、この画像にあるこのテンプレートを{{Vector version available|新しい画像ファイル名.svg}}テンプレートで置き換えてください。

キャプション

このファイルの内容を1行で記述してください

このファイルに描写されている項目

題材

29a648d3461c82e403048ba0f04aec90ab8cd62e

29,177 バイト

573 ピクセル

500 ピクセル

ファイルの履歴

過去の版のファイルを表示するには、その版の日時をクリックしてください。

日付と時刻サムネイル寸法利用者コメント
現在の版2014年7月16日 (水) 17:082014年7月16日 (水) 17:08時点における版のサムネイル500 × 573 (28キロバイト)JeffyPShrinkin' the image.
2006年4月10日 (月) 06:452006年4月10日 (月) 06:45時点における版のサムネイル500 × 573 (37キロバイト)Pflatau== Description == thumb|right|250px|Instrumental temperature record of the last 150 years. This data is the same as the black curve in the figure. This figure, based on Meehl et al. (2004), shows the ability

以下のページがこのファイルを使用しています:

グローバルなファイル使用状況

以下に挙げる他のウィキがこの画像を使っています:

このファイルのグローバル使用状況を表示する。