
ファイル:3 phase rectification 2.svg

この SVG ファイルのこの PNG プレビューのサイズ: 397 × 600 ピクセル. その他の解像度: 159 × 240 ピクセル | 317 × 480 ピクセル | 508 × 768 ピクセル | 677 × 1,024 ピクセル | 1,355 × 2,048 ピクセル | 624 × 943 ピクセル。
元のファイル (SVG ファイル、624 × 943 ピクセル、ファイルサイズ: 120キロバイト)
ウィキメディア・コモンズのファイルページにある説明を、以下に表示します。
|
概要
| 解説 |
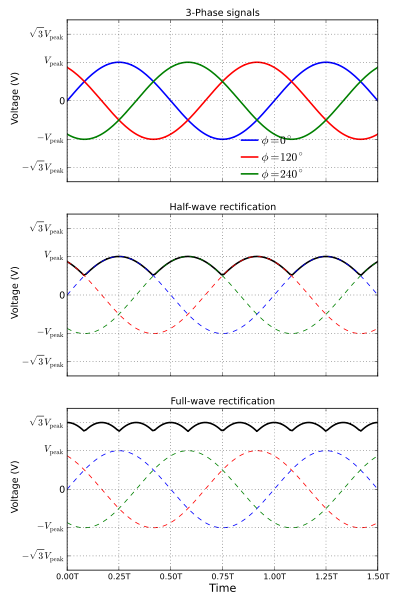
English: Waveforms for a typical 3-phase half-wave and full-wave rectifiers. The top plot shows the individual three phase signals, the middle plot shows the half-wave rectifier output in solid curve and the bottom plot shows the full-wave rectifier output in solid curve. The 'T' in time is the time period of individual signals and is the amplitude of each of the three input signals.
The diagram was created using python, matplotlib and numpy.
Русский: Формы сигналов трёхфазного одно- и двухполупериодного выпрямителей. Сверху - отдельные трехфазные сигналы, средний график - выход однополупериодного выпрямителя сплошной линией, нижний график - выходной сигнал двухполупериодного выпрямителя сплошной линией. T - период, U - напряжения. |
||
| 日付 | |||
| 原典 | 投稿者自身による著作物 | ||
| 作者 | Krishnavedala | ||
| その他のバージョン |
3 phase rectification 2.png
[]
.png:
.jpg:
|
||
| SVG 開発 | この ベクター画像はMatplotlibで作成されました。 | ||
| ソースコード | Python code
|


ライセンス
この作品の著作権者である私は、この作品を以下のライセンスで提供します。
このファイルはクリエイティブ・コモンズ 表示-継承 3.0 非移植ライセンスのもとに利用を許諾されています。
- あなたは以下の条件に従う場合に限り、自由に
- 共有 – 本作品を複製、頒布、展示、実演できます。
- 再構成 – 二次的著作物を作成できます。
- あなたの従うべき条件は以下の通りです。
- 表示 – あなたは適切なクレジットを表示し、ライセンスへのリンクを提供し、変更があったらその旨を示さなければなりません。これらは合理的であればどのような方法で行っても構いませんが、許諾者があなたやあなたの利用行為を支持していると示唆するような方法は除きます。
- 継承 – もしあなたがこの作品をリミックスしたり、改変したり、加工した場合には、あなたはあなたの貢献部分を元の作品とこれと同一または互換性があるライセンスの下に頒布しなければなりません。

|
この文書は、フリーソフトウェア財団発行のGNUフリー文書利用許諾書 (GNU Free Documentation License) 1.2またはそれ以降のバージョンの規約に基づき、複製や再配布、改変が許可されます。不可変更部分、表紙、背表紙はありません。このライセンスの複製は、GNUフリー文書利用許諾書という章に含まれています。 |
あなたは上記のライセンスから、どれか一つ以上を選択できます。
ファイルの履歴
過去の版のファイルを表示するには、その版の日時をクリックしてください。
| 日付と時刻 | サムネイル | 寸法 | 利用者 | コメント | |
|---|---|---|---|---|---|
| 現在の版 | 2011年9月23日 (金) 15:52 | | 624 × 943 (120キロバイト) | Krishnavedala | individual plots are now consistent with each other |
| 2011年9月22日 (木) 17:24 |  | 624 × 943 (114キロバイト) | Krishnavedala | final correction, hopefully!! | |
| 2011年9月22日 (木) 17:20 |  | 640 × 943 (116キロバイト) | Krishnavedala | corrected Time coordinates | |
| 2011年9月22日 (木) 17:04 |  | 623 × 943 (115キロバイト) | Krishnavedala | Corrected the waveforms for the full wave rectification. | |
| 2011年6月30日 (木) 22:06 |  | 599 × 944 (175キロバイト) | Spinningspark | Fixed correct use of italics. Fixed annotation outside boundary of image. Output waveform on top of input waveforms. | |
| 2011年6月30日 (木) 19:29 |  | 599 × 944 (111キロバイト) | Krishnavedala | removed "(sec)" from the x-axis label | |
| 2011年6月30日 (木) 19:27 |  | 599 × 946 (111キロバイト) | Krishnavedala | edits from suggestions in here | |
| 2011年6月17日 (金) 19:51 |  | 524 × 874 (142キロバイト) | Krishnavedala | thinner dashed lines | |
| 2011年6月17日 (金) 19:48 |  | 524 × 874 (142キロバイト) | Krishnavedala | all plots on the same scale to avoid confusion | |
| 2011年6月8日 (水) 17:18 |  | 594 × 946 (223キロバイト) | Krishnavedala | correction in the labels |
ファイルの使用状況
以下のページがこのファイルを使用しています:
グローバルなファイル使用状況
以下に挙げる他のウィキがこの画像を使っています:
- ca.wikipedia.org での使用状況
- cs.wikipedia.org での使用状況
- el.wikipedia.org での使用状況
- en.wikipedia.org での使用状況
- eo.wikipedia.org での使用状況
- eu.wikipedia.org での使用状況
- th.wikipedia.org での使用状況
- zh.wikipedia.org での使用状況