ファイル:Solar irradiance spectrum 1992.gif

ページのコンテンツが他言語でサポートされていません。

Solar_irradiance_spectrum_1992.gif(553 × 540 ピクセル、ファイルサイズ: 12キロバイト、MIME タイプ: image/gif)

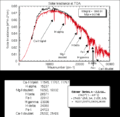
Spectrum of solar irradiance at top of Earth's atmosphere.

  • Neither Sun nor Earth are black bodies; both have significant absorption by certain gases in their atmospheres, which produce absorption lines in their electromagnetic spectra, which is the distribution of energy as a function of wavelength, or wavenumber.
  • Wavenumber is the number of waves per unit length, the inverse of wavelength, and is usually given in inverse centimeters, or cm-1, with 5,000 cm-1 corresponding to a wavelength of 2 millionths of a meter, or 2 microns. Taking inverses, 10000 cm-1 is 1 micron, 20000 cm-1 is 0.5 microns, and so on to larger wavenumbers, and similarly 2000 cm-1 is 5 microns, 1000 cm-1 is 10 microns, and so on to smaller wavenumbers.
  • The distribution of energy versus wavenumber is the spectrum.

The best current estimate of the spectrum of solar irradiance at the top of the atmosphere is based on line-by-line computations by Bob Kurucz of Harvard Smithsonian Observatory. Units are watts per square meter per inverse centimeters per steradian, and the original data has been degraded to 20 cm-1 resolution.

The red line gives the best post-1992 solar spectum estimate, and the dark line shows the best previous estimate of the spectrum. Note the marked improvement provided by the more recent higher spectral resolution line-by-line computations. (Note that if plotted directly in wavelength, the peak would be at 0.5 microns, but a change of variables to wavenumber shifts the peak to 10000 cm-1 = 1 micron.) Common absorption lines are identified, including doubly-ionized calcium and the first four lines of the hydrogen Balmer series.

Source

Public domain このファイルはアメリカ航空宇宙局(NASA)によって作成されたものです。NASAの著作権の方針では、特記事項が無い場合、NASAの資料はパブリックドメインとなります。
(詳しくはTemplate:PD-USGovNASAの著作権の方針について(英語)又はジェット推進研究所(JPL)の画像使用に関するガイドライン(英語)をご覧ください。)
注意事項:

Source: http://climate.gsfc.nasa.gov/~cahalan/Radiation/SolarIrr.html

Author: Robert Cahalan

(Moved from en:Image:Solar_irradiance_spectrum_1992.gif)

このグラフ画像は、ベクターイメージである SVG ファイルとして再作成されるべきです。これにはいくつかの利点があります。詳しくはCommons:Media for cleanupを参照してください。この画像の SVG 形式がすでに利用可能である場合は、アップロードしてください。アップロード後、この画像にあるこのテンプレートを{{Vector version available|新しい画像ファイル名.svg}}テンプレートで置き換えてください。

キャプション

このファイルの内容を1行で記述してください

このファイルに描写されている項目

題材

ファイルの履歴

過去の版のファイルを表示するには、その版の日時をクリックしてください。

日付と時刻サムネイル寸法利用者コメント
現在の版2006年2月4日 (土) 10:252006年2月4日 (土) 10:25時点における版のサムネイル553 × 540 (12キロバイト)Luis Fernández GarcíaTaken from en:Image:Solar_irradiance_spectrum_1992.gif {{PD-USGov-NASA}}

以下のページがこのファイルを使用しています:

グローバルなファイル使用状況

以下に挙げる他のウィキがこの画像を使っています: