
ファイル:Carbon cycle-cute diagram.jpeg
高解像度版はありません。
Carbon_cycle-cute_diagram.jpeg (540 × 417 ピクセル、ファイルサイズ: 52キロバイト、MIME タイプ: image/jpeg)
ウィキメディア・コモンズのファイルページにある説明を、以下に表示します。
|
概要
| 解説 |
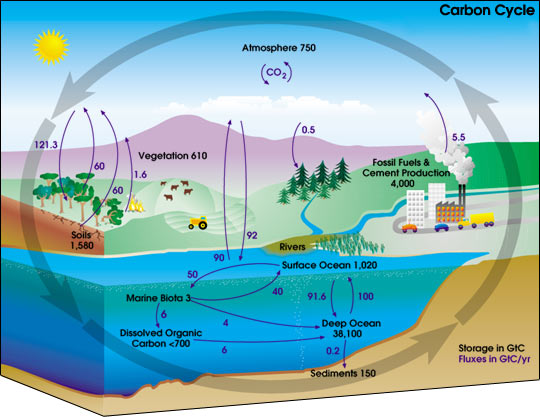
English: This carbon cycle diagram shows the storage and annual exchange of carbon between the atmosphere, hydrosphere and geosphere in gigatons - or billions of tons - of Carbon (GtC). Burning fossil fuels by people adds about 5.5 GtC of carbon per year into the atmosphere.
Deutsch: Diagramm des Kohlenstoffkreislaufes. Die schwarzen Zahlen zeigen wie viele Milliarden Tonnen Kohlenstoff (Gt C) in den verschiedenen Resevoiren vorhanden sind. Die blauen Zahlen zeigen an, wie viel Kohlenstoff zwischen den einzelnen Speichern pro Jahr ausgetauscht wird.
Español: Este esquema del ciclo del carbono muestra el almacenamiento y los cambios anuales del carbono entre la atmósfera, la hidrósfera y la geósfera en gigatones, o billones de toneladas, de carbono (GtC). La quema de conustibles fósiles libera cerca de 5.5 billones de toneladas de carbono al año en la atmósfera.
日本語: 炭素循環の概念図。黒の数値はそれぞれのリザーバーに存在する炭素量、青の数値はリザーバー間での年間の炭素の移動量。単位はギガt(10億トン)
Русский: Схема геохимического цикла углерода показывает количество углерода в атмосфере, гидросфере, и геосфере Земли, а также годовой перенос углерода между ними. Все величины в гигатоннах (миллиардах тонн). В результате сжигания ископаемого топлива, человечество ежегодно добавляет 5,5 гигатонн углерода в атмосферу.
Polski: Diagram obiegu węgla w przyrodzie pokazujący rezerwuary oraz roczną wymianę węgla między atmosferą i geosferą w gigatonach (miliardach ton) węgla. Spalanie paliw kopalnych przez przemysł emituje do atmosfery ok. 5,5 gigaton węgla rocznie. |
|||||
| 原典 | https://earthobservatory.nasa.gov/features/CarbonCycle | |||||
| 作者 | User Kevin Saff on en.wikipedia | |||||
| 許可 (ファイルの再利用) |
|
|||||
| その他のバージョン |
[] Single-language versions
このファイルの派生的著作物: Originally from en.wikipedia; description page is (was) here * 20:01, 6 May 2004 [[:en:User:Kevin Saff|Kevin Saff]] 540×417 (53,453 bytes) <span class="comment">([[:en:Carbon cycle]], diagram with little cars and things.)</span> File:Carbon cycle-cute diagram-zh-Hans.jpeg |


(Uploaded using CommonsHelper or PushForCommons アーカイブされたコピー at the Wayback Machine)
ライセンス
| このファイルはアメリカ航空宇宙局(NASA)によって作成されたものです。NASAの著作権の方針では、特記事項が無い場合、NASAの資料はパブリックドメインとなります。 (詳しくはTemplate:PD-USGov、NASAの著作権の方針について(英語)又はジェット推進研究所(JPL)の画像使用に関するガイドライン(英語)をご覧ください。) |
||
 |
注意事項:
|

|
このファイルのベクター画像 (SVG) が利用できます。 使う目的に対し、元画像よりもSVGがより優れている場合、SVG画像を使用して下さい。
File:Carbon cycle-cute diagram.jpeg → File:Carbon cycle-cute diagram.svg
|
 |
ファイルの履歴
過去の版のファイルを表示するには、その版の日時をクリックしてください。
| 日付と時刻 | サムネイル | 寸法 | 利用者 | コメント | |
|---|---|---|---|---|---|
| 現在の版 | 2006年9月12日 (火) 15:16 | | 540 × 417 (52キロバイト) | Giac83 | {{Information| |Description= This en:carbon cycle diagram shows the storage and yearly changes of the carbon between the atmosphere, en:hydrosphere and en:geosphere in Gigatons - or billion tons - of Carbon (GtC). |
ファイルの使用状況
このファイルを使用しているページはありません。
グローバルなファイル使用状況
以下に挙げる他のウィキがこの画像を使っています:
- ar.wikipedia.org での使用状況
- el.wikipedia.org での使用状況
- en.wikipedia.org での使用状況
- Organic geochemistry
- Wikipedia:Featured picture candidates/April-2005
- Wikipedia:Featured picture candidates/Carbon cycle
- Portal:Ecology/Selected picture
- Portal:Environment/Selected picture
- Portal:Environment/Selected picture/11
- Wikipedia:Reference desk/Archives/Miscellaneous/2007 November 14
- User:Epipelagic/sandbox/current1
- User:Pha08rsi/Carbon Chemistry
- Portal:Ecology/Selected picture/15