
ファイル:Aquatic Dead Zones.jpg

このプレビューのサイズ: 800 × 468 ピクセル。 その他の解像度: 320 × 187 ピクセル | 640 × 375 ピクセル | 1,024 × 599 ピクセル | 1,280 × 749 ピクセル | 2,560 × 1,499 ピクセル | 3,577 × 2,094 ピクセル。
元のファイル (3,577 × 2,094 ピクセル、ファイルサイズ: 856キロバイト、MIME タイプ: image/jpeg)
ウィキメディア・コモンズのファイルページにある説明を、以下に表示します。
|
概要
| 解説 |
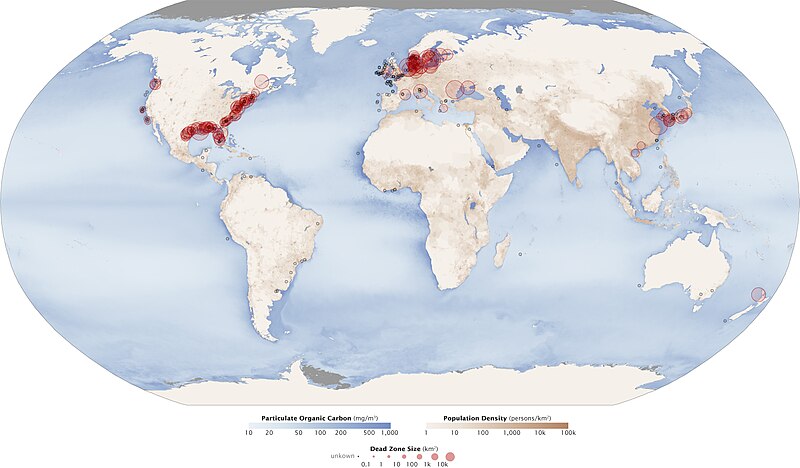
English: Red circles on this map show the location and size of many of our planet’s dead zones. Black dots show where dead zones have been observed, but their size is unknown. It’s no coincidence that dead zones occur downriver of places where human population density is high (darkest brown). Darker blues in this image show higher concentrations of particulate organic matter, an indication of the overly fertile waters that can culminate in dead zones. |
| 日付 | |
| 原典 | NASA Earth Observatory |
| 作者 | Robert Simmon & Jesse Allen |
Data from Robert Diaz, Virginia Institute of Marine Science (dead zones); the GSFC Ocean Color team (particulate organic carbon); and the Socioeconomic Data and Applications Center (SEDAC) (population density).
ライセンス
| このファイルはアメリカ航空宇宙局(NASA)によって作成されたものです。NASAの著作権の方針では、特記事項が無い場合、NASAの資料はパブリックドメインとなります。 (詳しくはTemplate:PD-USGov、NASAの著作権の方針について(英語)又はジェット推進研究所(JPL)の画像使用に関するガイドライン(英語)をご覧ください。) |
||
 |
注意事項:
|
ファイルの履歴
過去の版のファイルを表示するには、その版の日時をクリックしてください。
| 日付と時刻 | サムネイル | 寸法 | 利用者 | コメント | |
|---|---|---|---|---|---|
| 現在の版 | 2010年7月19日 (月) 12:17 | | 3,577 × 2,094 (856キロバイト) | Originalwana | {{Information |Description={{en|1=Red circles on this map show the location and size of many of our planet’s dead zones. Black dots show where dead zones have been observed, but their size is unknown. It’s no coincidence that dea |
ファイルの使用状況
以下の 2 ページがこのファイルを使用しています:
グローバルなファイル使用状況
以下に挙げる他のウィキがこの画像を使っています:
- ar.wikipedia.org での使用状況
- bs.wikipedia.org での使用状況
- cs.wikipedia.org での使用状況
- da.wikipedia.org での使用状況
- de.wikipedia.org での使用状況
- en.wikipedia.org での使用状況
- en.wikibooks.org での使用状況
- es.wikipedia.org での使用状況
- fa.wikipedia.org での使用状況
- fr.wikipedia.org での使用状況
- it.wikipedia.org での使用状況
- ml.wikipedia.org での使用状況
- pl.wikipedia.org での使用状況
- pt.wikipedia.org での使用状況
- ru.wikipedia.org での使用状況
- simple.wikipedia.org での使用状況
- tr.wikipedia.org での使用状況
- uk.wikipedia.org での使用状況
- zh.wikipedia.org での使用状況