
ファイル:Timeline of US overdose deaths involving heroin, by other opioid involvement.jpg

このプレビューのサイズ: 800 × 600 ピクセル。 その他の解像度: 320 × 240 ピクセル | 640 × 480 ピクセル | 1,024 × 768 ピクセル | 1,200 × 900 ピクセル。
元のファイル (1,200 × 900 ピクセル、ファイルサイズ: 188キロバイト、MIME タイプ: image/jpeg)
ウィキメディア・コモンズのファイルページにある説明を、以下に表示します。
|

|
このファイルのベクター画像 (SVG) が利用できます。 使う目的に対し、元画像よりもSVGがより優れている場合、SVG画像を使用して下さい。
File:Timeline of US overdose deaths involving heroin, by other opioid involvement.jpg → File:US timeline. Heroin deaths.svg
|
 |
概要
| 解説 |
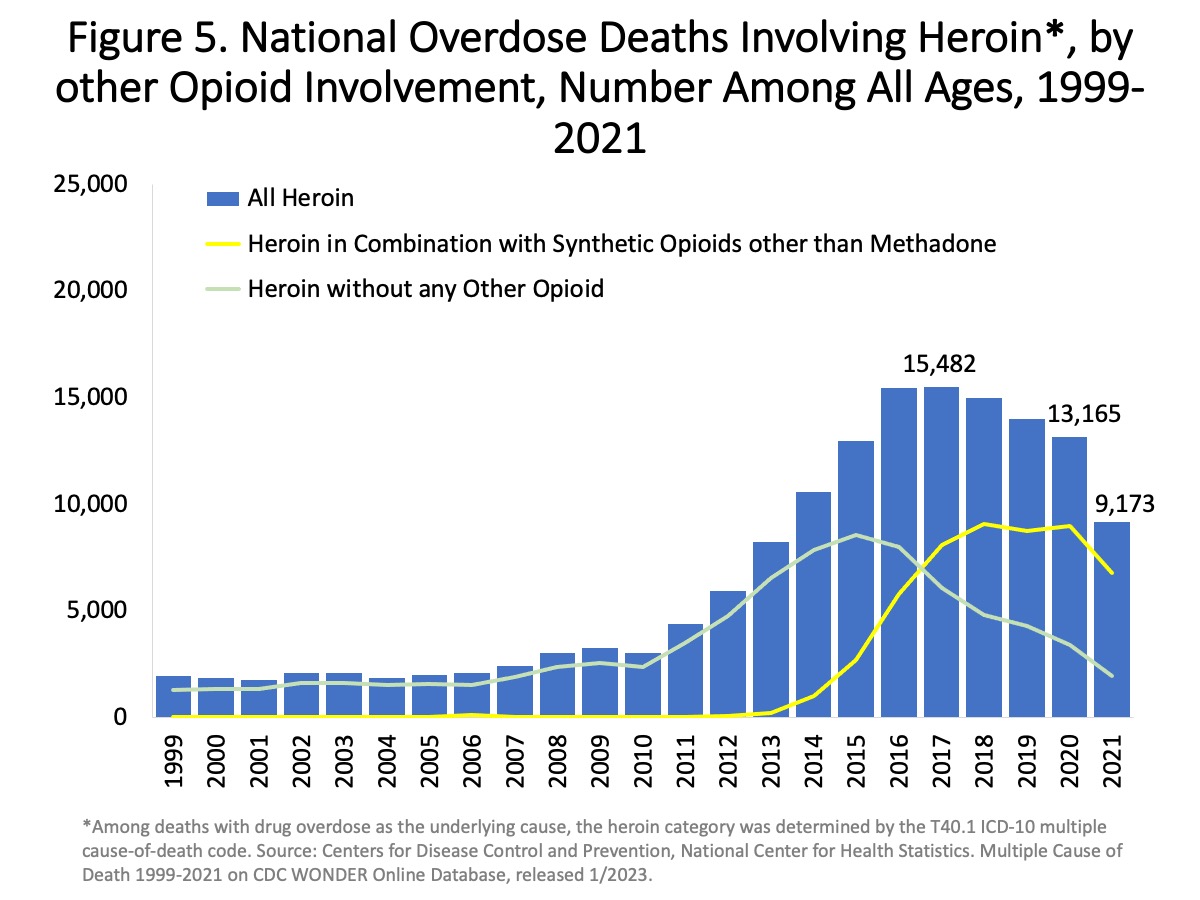
English: "Figure 5. National Overdose Deaths Involving Heroin, by Other Opioid Involvement—Number Among All Ages, 1999-2021. The figure above is a bar and line graph showing the total number of U.S. overdose deaths involving heroin from 1999 to 2021. Drug overdose deaths involving heroin rose from 1,960 in 1999 to 15,482 in 2017 before trending down to 13,165 deaths in 2020 and 9,173 deaths in 2021. The bars are overlaid by lines showing the number of deaths involving heroin in combination with synthetic opioids other than methadone (primarily fentanyl) or without any other opioid from 1999 to 2021 (Source: CDC WONDER)." |
| 日付 | - date of first upload to the Commons. See file history for dates of later uploads. |
| 原典 | Overdose Death Rates. By National Institute on Drug Abuse (NIDA). 1999-2021 chart. 1999-2019 chart. 2002-2017 chart. 2002-2015 chart. 2001-2014 chart. |
| 作者 | National Institute on Drug Abuse. Some versions of the chart were cropped, and have had "USA" added to them. Freeware IrfanView, etc. can be used. See Commons:Convert tables and charts to wiki code or image files, and the section about adding text to chart images. |
ライセンス
この画像は、アメリカ合衆国保健福祉省の機関である国立衛生研究所の職員が、公務の一環として撮影し、又は作成したものです。アメリカ合衆国連邦政府の著作物として、この画像はパブリックドメインの状態にあります。
 |
||
| このファイルは著作権法の既知の制約(隣接権や関連する権利を含む)から自由であると特定されています。 | ||
ファイルの履歴
過去の版のファイルを表示するには、その版の日時をクリックしてください。
| 日付と時刻 | サムネイル | 寸法 | 利用者 | コメント | |
|---|---|---|---|---|---|
| 現在の版 | 2023年7月22日 (土) 00:00 | | 1,200 × 900 (188キロバイト) | Timeshifter | Latest |
| 2021年8月31日 (火) 08:52 |  | 1,150 × 865 (184キロバイト) | Timeshifter | Latest chart from source. | |
| 2018年9月6日 (木) 15:23 |  | 810 × 589 (94キロバイト) | Timeshifter | newer chart | |
| 2017年3月27日 (月) 10:51 |  | 794 × 636 (91キロバイト) | Timeshifter | 2015 column. | |
| 2016年1月1日 (金) 11:11 |  | 791 × 586 (84キロバイト) | Timeshifter | User created page with UploadWizard |
ファイルの使用状況
グローバルなファイル使用状況
以下に挙げる他のウィキがこの画像を使っています:
- ar.wikipedia.org での使用状況
- en.wikipedia.org での使用状況
- es.wikipedia.org での使用状況
- hy.wikipedia.org での使用状況
- sr.wikipedia.org での使用状況
- vi.wikipedia.org での使用状況
- zh.wikipedia.org での使用状況