
ファイル:Subprime crisis - Foreclosures & Bank Instability.png

元のファイル (960 × 720 ピクセル、ファイルサイズ: 16キロバイト、MIME タイプ: image/png)
ウィキメディア・コモンズのファイルページにある説明を、以下に表示します。
|

|
このダイアグラムの画像は、ベクターイメージである SVG ファイルとして再作成されるべきです。これにはいくつかの利点があります。詳しくはCommons:Media for cleanupを参照してください。この画像の SVG 形式がすでに利用可能である場合は、アップロードしてください。アップロード後、この画像にあるこのテンプレートを{{Vector version available|新しい画像ファイル名.svg}}テンプレートで置き換えてください。
|
| 解説 |
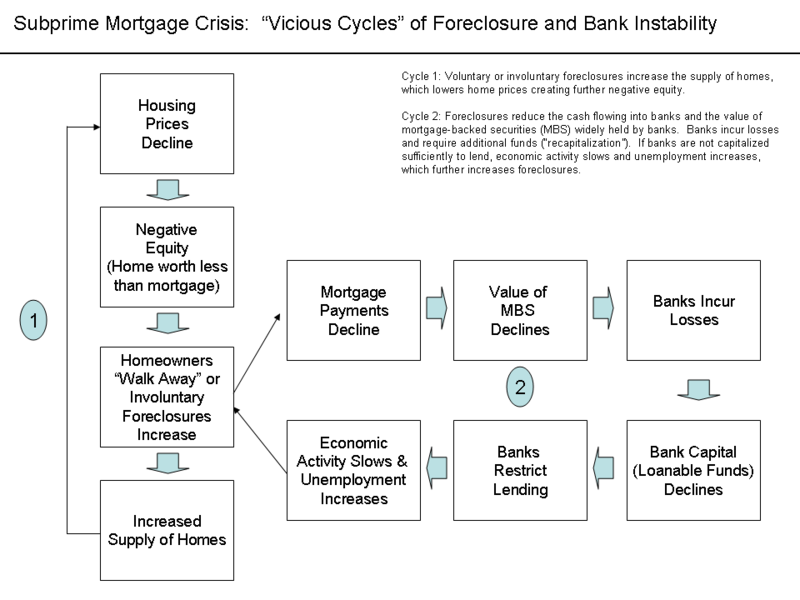
English: Chart showing feedback loops within housing market and with financial market and economy 概要This diagram explains two vicious cycles at the heart of the subprime mortgage crisis. Cycle One: Housing MarketThe first cycle is within the housing market. Voluntary or involuntary foreclosures increase the supply of homes, which lowers home prices creating further negative equity. By September 2008, average U.S. housing prices had declined by over 20% from their mid-2006 peak.[1][2] This major and unexpected decline in house prices means that many borrowers have zero or negative equity in their homes, meaning their homes were worth less than their mortgages. As of March 2008, an estimated 8.8 million borrowers — 10.8% of all homeowners — had negative equity in their homes, a number that is believed to have risen to 12 million by November 2008. Borrowers in this situation have an incentive to "walk away" from their mortgages and abandon their homes, even though doing so will damage their credit rating for a number of years. The reason is that unlike what is the case in most other countries, American residential mortgages are non-recourse loans; once the creditor has regained the property purchased with a mortgage in default, he has no further claim against the defaulting borrower's income or assets. As more borrowers stop paying their mortgage payments, foreclosures and the supply of homes for sale increase. This places downward pressure on housing prices, which further lowers homeowners' equity. The decline in mortgage payments also reduces the value of mortgage-backed securities, which erodes the net worth and financial health of banks. This vicious cycle is at the heart of the crisis.[3] Cycle Two: Financial Market and Feedback into Housing MarketForeclosures reduce the cash flowing into banks and the value of mortgage-backed securities (MBS) widely held by banks. Banks incur losses and require additional funds (“recapitalization”). If banks are not capitalized sufficiently to lend, economic activity slows and unemployment increases, which further increases foreclosures. As of August 2008, financial firms around the globe have written down their holdings of subprime related securities by US$501 billion. Mortgage defaults and provisions for future defaults caused profits at the 8533 USA depository institutions insured by the FDIC to decline from $35.2 billion in 2006 Q4 billion to $646 million in the same quarter a year later, a decline of 98%. 2007 Q4 saw the worst bank and thrift quarterly performance since 1990. In all of 2007, insured depository institutions earned approximately $100 billion, down 31% from a record profit of $145 billion in 2006. Profits declined from $35.6 billion in 2007 Q1 to $19.3 billion in 2008 Q1, a decline of 46%. Federal Reserve data indicates banks have significantly tightened lending standards throughout the crisis.[4] Unemployment in the U.S. has increased to a 14-year high as of November 2008.[5] Further Sources and SolutionsEconomist Nouriel Roubini described the vicious cycles within and across the housing market and financial markets during interviews with Charlie Rose in September and October 2008.[6] He further describes the crisis in these other video segments.[7][8] He called for an additional $250 billion to help recapitalize the banks, closure of insolvent "zombie" banks, regulatory overhaul, and $300 billion in infrastructure spending during these interviews. ReferencesSee alsoThe images below contain additional high-level explanation of the crisis further citations. thumb|Factors Contributing to Housing Bubble – Diagram 1 of 2 thumb|Domino Effect As Housing Prices Declined – Diagram 2 of 2 |
| 日付 | |
| 原典 | 投稿者自身による著作物 (Original text: I created this work entirely by myself.) |
| 作者 | Farcaster (talk) 17:06, 26 December 2008 (UTC) |
- ↑ Case Shiller Index
- ↑ Economist-A Helping Hand to Homeowners
- ↑ NYT - How to Help People Who's Homes are Underwater
- ↑ Banks Tighten Lending Standards
- ↑ https://www.nytimes.com/2008/11/08/business/economy/08econ.html?pagewanted=print NY Times - Unemployment]
- ↑ Charlie Rose - Roubini & Panel
- ↑ Rose & Roubini Discussion
- ↑ Rose & Roubini
ライセンス
- あなたは以下の条件に従う場合に限り、自由に
- 共有 – 本作品を複製、頒布、展示、実演できます。
- 再構成 – 二次的著作物を作成できます。
- あなたの従うべき条件は以下の通りです。
- 表示 – あなたは適切なクレジットを表示し、ライセンスへのリンクを提供し、変更があったらその旨を示さなければなりません。これらは合理的であればどのような方法で行っても構いませんが、許諾者があなたやあなたの利用行為を支持していると示唆するような方法は除きます。
- 継承 – もしあなたがこの作品をリミックスしたり、改変したり、加工した場合には、あなたはあなたの貢献部分を元の作品とこれと同一または互換性があるライセンスの下に頒布しなければなりません。

|
この文書は、フリーソフトウェア財団発行のGNUフリー文書利用許諾書 (GNU Free Documentation License) 1.2またはそれ以降のバージョンの規約に基づき、複製や再配布、改変が許可されます。不可変更部分、表紙、背表紙はありません。このライセンスの複製は、GNUフリー文書利用許諾書という章に含まれています。 |
元のアップロードログ
- 2008-12-26 17:34 Farcaster 960×720× (16380 bytes)
- 2008-12-26 17:29 Farcaster 960×720× (16314 bytes)
- 2008-12-26 17:06 Farcaster 960×720× (16314 bytes) {{Information |Description=Chart showing feedback loops within housing market and with financial market and economy |Source=I created this work entirely by myself. |Date= |Author=~~~~ |other_versions= }}
ファイルの履歴
過去の版のファイルを表示するには、その版の日時をクリックしてください。
| 日付と時刻 | サムネイル | 寸法 | 利用者 | コメント | |
|---|---|---|---|---|---|
| 現在の版 | 2010年10月14日 (木) 00:51 | | 960 × 720 (16キロバイト) | Hideokun | {{Information |Description={{en|Chart showing feedback loops within housing market and with financial market and economy<br/> ==Description== This diagram explains two vicious cycles at the heart of the [[:en:subprime mortgage crisis |
ファイルの使用状況
以下の 2 ページがこのファイルを使用しています:
グローバルなファイル使用状況
以下に挙げる他のウィキがこの画像を使っています:
- en.wikipedia.org での使用状況
- fa.wikipedia.org での使用状況
- hi.wikipedia.org での使用状況
- pt.wikipedia.org での使用状況
- ta.wikipedia.org での使用状況