
ファイル:Kernel trick idea.svg

この SVG ファイルのこの PNG プレビューのサイズ: 800 × 343 ピクセル. その他の解像度: 320 × 137 ピクセル | 640 × 274 ピクセル | 1,024 × 439 ピクセル | 1,280 × 549 ピクセル | 2,560 × 1,097 ピクセル | 1,344 × 576 ピクセル。
元のファイル (SVG ファイル、1,344 × 576 ピクセル、ファイルサイズ: 13キロバイト)
ウィキメディア・コモンズのファイルページにある説明を、以下に表示します。
|
概要
| 解説 |
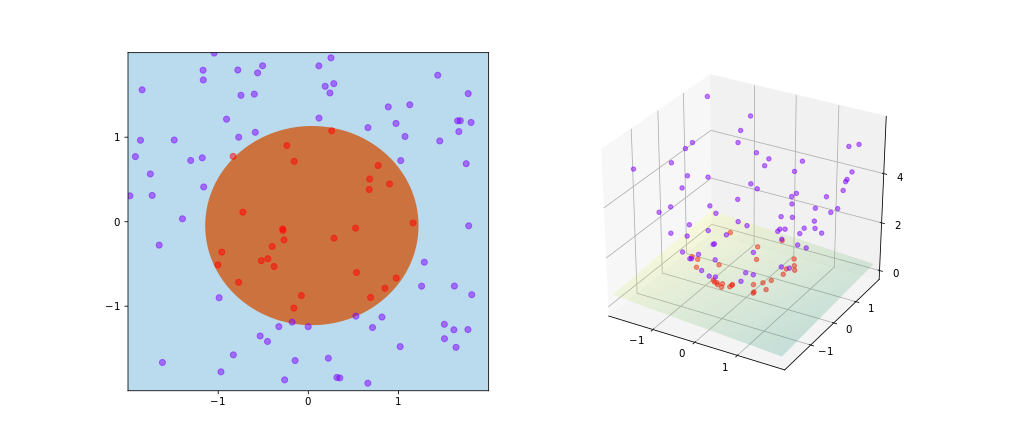
English: An illustration of kernel trick in SVM. Here the kernel is given by:
|
| 日付 | |
| 原典 | 投稿者自身による著作物 |
| 作者 | Shiyu Ji |


Python Source Code
import numpy as np
import matplotlib
matplotlib.use('svg')
import matplotlib.pyplot as plt
from sklearn import svm
from matplotlib import cm

# Prepare the training set.
# Suppose there is a circle with center at (0, 0) and radius 1.2.
# All the points within the circle are labeled 1.
# All the points outside the circle are labeled 0.
nSamples = 100
spanLen = 2
X = np.zeros((nSamples, 2))
y = np.zeros((nSamples, ))

for i in range(nSamples):
  a, b = [np.random.uniform(-spanLen, spanLen) for _ in ['x', 'y']]
  X[i][0], X[i][1] = a, b
  y[i] = 1 if a*a + b*b < 1.2*1.2 else 0

# Custom kernel,
def my_kernel(A, B):
  gram = np.zeros((A.shape[0], B.shape[0]))
  for i in range(A.shape[0]):
    for j in range(B.shape[0]):
      assert A.shape[1] == B.shape[1]
      L2A, L2B = 0.0, 0.0
      for k in range(A.shape[1]):
        gram[i, j] += A[i, k] * B[j, k]
        L2A += A[i, k] * A[i, k]
        L2B += B[j, k] * B[j, k]
      gram[i, j] += L2A * L2B
  return gram

# SVM train.
clf = svm.SVC(kernel = my_kernel)
clf.fit(X, y)
coef = clf.dual_coef_[0]
sup = clf.support_
b = clf.intercept_
x_min, x_max = -spanLen, spanLen
y_min, y_max = -spanLen, spanLen
xx, yy = np.meshgrid(np.arange(x_min, x_max, .02), np.arange(y_min, y_max, .02))
Z = clf.predict(np.c_[xx.ravel(), yy.ravel()])
Z = Z.reshape(xx.shape)

# Plot the 2D layout.
fig = plt.figure(figsize = (6, 14))
plt1 = plt.subplot(121)
plt1.set_xlim([-spanLen, spanLen])
plt1.set_ylim([-spanLen, spanLen])
plt1.set_xticks([-1, 0, 1])
plt1.set_yticks([-1, 0, 1])
plt1.pcolormesh(xx, yy, Z, cmap=cm.Paired)
y_unique = np.unique(y)
colors = cm.rainbow(np.linspace(0.0, 1.0, y_unique.size))
for this_y, color in zip(y_unique, colors):
  this_Xx = [X[i][0] for i in range(len(X)) if y[i] == this_y]
  this_Xy = [X[i][1] for i in range(len(X)) if y[i] == this_y]
  plt1.scatter(this_Xx, this_Xy, c=color, alpha=0.5)

# Process the training data into 3D by applying the kernel mapping:
# phi(x, y) = (x, y, x*x + y*y).
X3d = np.ndarray((X.shape[0], 3))
for i in range(X.shape[0]):
    a, b = X[i][0], X[i][1]
    X3d[i, 0], X3d[i, 1], X3d[i, 2] = [a, b, a*a + b*b]

# Plot the 3D layout after applying the kernel mapping.
from mpl_toolkits.mplot3d import Axes3D
plt2 = plt.subplot(122, projection="3d")
plt2.set_xlim([-spanLen, spanLen])
plt2.set_ylim([-spanLen, spanLen])
plt2.set_xticks([-1, 0, 1])
plt2.set_yticks([-1, 0, 1])
plt2.set_zticks([0, 2, 4])
for this_y, color in zip(y_unique, colors):
  this_Xx = [X3d[i, 0] for i in range(len(X3d)) if y[i] == this_y]
  this_Xy = [X3d[i, 1] for i in range(len(X3d)) if y[i] == this_y]
  this_Xz = [X3d[i, 2] for i in range(len(X3d)) if y[i] == this_y]
  plt2.scatter(this_Xx, this_Xy, this_Xz, c=color, alpha=0.5)

# Plot the 3D boundary.
def onBoundary(x, y, z, X3d, coef, sup, b):
  err = 0.0
  n = len(coef)
  for i in range(n):
    err += coef[i] * (x*X3d[sup[i], 0] + y*X3d[sup[i], 1] + z*X3d[sup[i], 2])
  err += b
  if abs(err) < .1:
    return True
  return False

Xr = np.arange(x_min, x_max, .02)
Yr = np.arange(y_min, y_max, .02)
Z = np.zeros(Z.shape)
for i in range(Xr.shape[0]):
  x = Xr[i]
  for j in range(Yr.shape[0]):
    y = Yr[j]
    for z in np.arange(0, 2, .02):
      if onBoundary(x, y, z, X3d, coef, sup, b):
        Z[i, j] = z
        break
plt2.plot_surface(xx, yy, Z, cmap='summer', alpha=0.2)

plt.savefig("kernel_trick_idea.svg", format = "svg")
ライセンス
この作品の著作権者である私は、この作品を以下のライセンスで提供します。
このファイルはクリエイティブ・コモンズ 表示-継承 4.0 国際ライセンスのもとに利用を許諾されています。
- あなたは以下の条件に従う場合に限り、自由に
- 共有 – 本作品を複製、頒布、展示、実演できます。
- 再構成 – 二次的著作物を作成できます。
- あなたの従うべき条件は以下の通りです。
- 表示 – あなたは適切なクレジットを表示し、ライセンスへのリンクを提供し、変更があったらその旨を示さなければなりません。これらは合理的であればどのような方法で行っても構いませんが、許諾者があなたやあなたの利用行為を支持していると示唆するような方法は除きます。
- 継承 – もしあなたがこの作品をリミックスしたり、改変したり、加工した場合には、あなたはあなたの貢献部分を元の作品とこれと同一または互換性があるライセンスの下に頒布しなければなりません。
ファイルの履歴
過去の版のファイルを表示するには、その版の日時をクリックしてください。
| 日付と時刻 | サムネイル | 寸法 | 利用者 | コメント | |
|---|---|---|---|---|---|
| 現在の版 | 2020年7月17日 (金) 14:41 | | 1,344 × 576 (13キロバイト) | SemperVinco | Optimized svg code |
| 2017年6月28日 (水) 06:08 |  | 1,260 × 540 (8.06メガバイト) | Shiyu Ji | Reverted to version as of 05:28, 28 June 2017 (UTC) | |
| 2017年6月28日 (水) 06:05 |  | 540 × 1,260 (7.33メガバイト) | Shiyu Ji | vertical for better display | |
| 2017年6月28日 (水) 05:28 |  | 1,260 × 540 (8.06メガバイト) | Shiyu Ji | User created page with UploadWizard |
ファイルの使用状況
以下のページがこのファイルを使用しています:
グローバルなファイル使用状況
以下に挙げる他のウィキがこの画像を使っています:
- ca.wikipedia.org での使用状況
- de.wikipedia.org での使用状況
- en.wikipedia.org での使用状況
- es.wikipedia.org での使用状況
- fa.wikipedia.org での使用状況
- fr.wikipedia.org での使用状況
- it.wikipedia.org での使用状況
- ru.wikipedia.org での使用状況
- sr.wikipedia.org での使用状況
- uk.wikipedia.org での使用状況
- zh.wikipedia.org での使用状況