
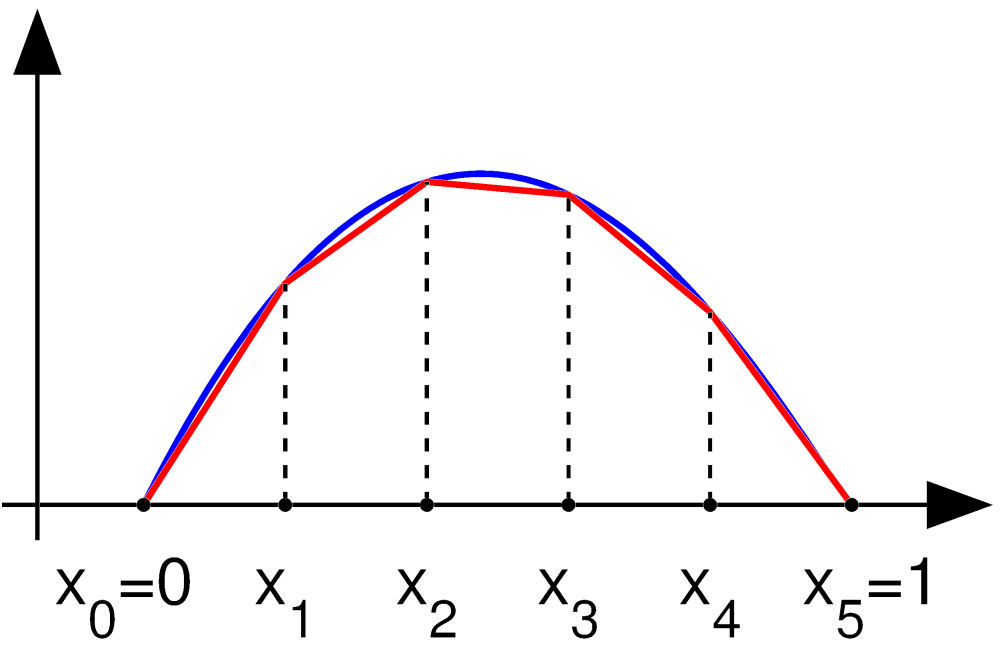
ファイル:Finite element method 1D illustration1.png
このプレビューのサイズ: 800 × 520 ピクセル。 その他の解像度: 320 × 208 ピクセル | 640 × 416 ピクセル | 1,002 × 651 ピクセル。
元のファイル (1,002 × 651 ピクセル、ファイルサイズ: 42キロバイト、MIME タイプ: image/png)
ウィキメディア・コモンズのファイルページにある説明を、以下に表示します。
|
概要

|
このファイルのベクター画像 (SVG) が利用できます。 使う目的に対し、元画像よりもSVGがより優れている場合、SVG画像を使用して下さい。
File:Finite element method 1D illustration1.png → File:Finite element method 1D illustration1.svg
|
 |
en.wikipedia からコモンズに Maksim によって移動されました。
元のファイルページはこちら。以下の利用者は全てen.wikipediaに属します。
ライセンス
| この著作物の著作権者である私は、この著作物における権利を放棄しパブリックドメインとします。これは全世界で適用されます。 一部の国では、これが法的に可能ではない場合があります。その場合は、次のように宣言します。 私は、あらゆる人に対して、法により必要とされている条件を除き、如何なる条件も課すことなく、あらゆる目的のためにこの著作物を使用する権利を与えます。 |
Source code
function main () % draw an illustration for finite element method

% prepare the scrreen and define some parameters
clf; hold on; axis equal; axis off;
fontsize=30; thick_line=3; thin_line=2; black=[0, 0, 0]; red=[1, 0, 0]; blue=[0, 0, 1];
arrowsize=0.1; arrow_type=1; arrow_angle=20; % (angle in degrees)
circrad=0.01; % radius of ball showing up in places

a=0; b=1; % interval endpoints
X=a:0.01:b; f=inline('2*x.*(1-x).^1.1'); Y=f(X); % the function
h=0.2; Xh=a:h:b; Yh=f(Xh);  % the linear approximation

% x and y axes
arrow([a-0.2 0], [b+0.2, 0], thin_line, arrowsize, arrow_angle, arrow_type, black)
arrow([-0.15 -0.05], [-0.15, 1.5*max(Y)], thin_line, arrowsize, arrow_angle, arrow_type, black)

% plot the graphs
plot(X, Y, 'linewidth', thick_line); % mesh, and the function
plot(Xh, Yh, 'linewidth', thick_line, 'color', red)

%% place some dashed lines
for i=2:(length(Xh)-1)
   plot([Xh(i) Xh(i)], [0, Yh(i)], 'linewidth', thin_line, 'linestyle', '--', 'color', 'black');
end

% some balls for beauty
ball(a, 0, circrad, black);
ball(b, 0, circrad, black);
for i=2:(length(Xh)-1)
   ball(Xh(i), 0, circrad, black);
end

%% place text
tiny=0.07;
H=text(a+0.07, -tiny,  'x_0=0'); set(H, 'fontsize', fontsize, 'HorizontalAlignment', 'r', 'VerticalAlignment', 'top');
H=text(b-0.07, -tiny,  'x_5=1'); set(H, 'fontsize', fontsize, 'HorizontalAlignment', 'l', 'VerticalAlignment', 'top');
for i=2:(length(Xh)-1)
   H=text(Xh(i), -tiny,  sprintf('x_%d', i-1));
   set(H, 'fontsize', fontsize, 'HorizontalAlignment', 'c', 'VerticalAlignment', 'top');
end

saveas(gcf, 'Finite_element_method_1D_illustration1.eps', 'psc2') % export to eps

function ball(x, y, r, color)
   Theta=0:0.1:2*pi;
   X=r*cos(Theta)+x;
   Y=r*sin(Theta)+y;
   H=fill(X, Y, color);
   set(H, 'EdgeColor', 'none');

function arrow(start, stop, thickness, arrow_size, sharpness, arrow_type, color)

% Function arguments:
% start, stop:  start and end coordinates of arrow, vectors of size 2
% thickness:    thickness of arrow stick
% arrow_size:   the size of the two sides of the angle in this picture ->
% sharpness:    angle between the arrow stick and arrow side, in degrees
% arrow_type:   1 for filled arrow, otherwise the arrow will be just two segments
% color:        arrow color, a vector of length three with values in [0, 1]

% convert to complex numbers
   i=sqrt(-1);
   start=start(1)+i*start(2); stop=stop(1)+i*stop(2);
   rotate_angle=exp(i*pi*sharpness/180);

% points making up the arrow tip (besides the "stop" point)
   point1 = stop - (arrow_size*rotate_angle)*(stop-start)/abs(stop-start);
   point2 = stop - (arrow_size/rotate_angle)*(stop-start)/abs(stop-start);

   if arrow_type==1 % filled arrow

      % plot the stick, but not till the end, looks bad
      t=0.5*arrow_size*cos(pi*sharpness/180)/abs(stop-start); stop1=t*start+(1-t)*stop;
      plot(real([start, stop1]), imag([start, stop1]), 'LineWidth', thickness, 'Color', color);

      % fill the arrow
      H=fill(real([stop, point1, point2]), imag([stop, point1, point2]), color);
      set(H, 'EdgeColor', 'none')

   else % two-segment arrow
      plot(real([start, stop]), imag([start, stop]),   'LineWidth', thickness, 'Color', color);
      plot(real([stop, point1]), imag([stop, point1]), 'LineWidth', thickness, 'Color', color);
      plot(real([stop, point2]), imag([stop, point2]), 'LineWidth', thickness, 'Color', color);
   end
| date/time | username | edit summary |
|---|---|---|
| 01:53, 29 December 2005 | en:User:Oleg Alexandrov | (+source code) |
| 01:30, 29 December 2005 | en:User:Oleg Alexandrov |
元のアップロードログ
Legend: (cur) = this is the current file, (del) = delete this old version, (rev) = revert to this old version.
Click on date to download the file or see the image uploaded on that date.
- (del) (cur) 01:51, 29 December 2005 . . en:User:Oleg_Alexandrov Oleg Alexandrov ( en:User_talk:Oleg_Alexandrov Talk) . . 1002x651 (43514 bytes)
- (del) (rev) 01:50, 29 December 2005 . . en:User:Oleg_Alexandrov Oleg Alexandrov ( en:User_talk:Oleg_Alexandrov Talk) . . 1002x636 (43741 bytes)
- (del) (rev) 01:49, 29 December 2005 . . en:User:Oleg_Alexandrov Oleg Alexandrov ( en:User_talk:Oleg_Alexandrov Talk) . . 1002x636 (43741 bytes)
- (del) (rev) 01:48, 29 December 2005 . . en:User:Oleg_Alexandrov Oleg Alexandrov ( en:User_talk:Oleg_Alexandrov Talk) . . 1002x636 (43572 bytes)
- (del) (rev) 01:30, 29 December 2005 . . en:User:Oleg_Alexandrov Oleg Alexandrov ( en:User_talk:Oleg_Alexandrov Talk) . . 1002x636 (43572 bytes)
ファイルの履歴
過去の版のファイルを表示するには、その版の日時をクリックしてください。
| 日付と時刻 | サムネイル | 寸法 | 利用者 | コメント | |
|---|---|---|---|---|---|
| 現在の版 | 2006年3月18日 (土) 20:01 | | 1,002 × 651 (42キロバイト) | Maksim | La bildo estas kopiita de wikipedia:en. La originala priskribo estas: == Licensing == {{PD-self}} ==Source code== <pre> <nowiki> function main () % draw an illustration for finite element method % prepare the scrreen and define some parameters clf; |
ファイルの使用状況
以下のページがこのファイルを使用しています:
グローバルなファイル使用状況
以下に挙げる他のウィキがこの画像を使っています:
- ar.wikipedia.org での使用状況
- ca.wikipedia.org での使用状況
- en.wikipedia.org での使用状況
- es.wikipedia.org での使用状況
- fi.wikipedia.org での使用状況
- pl.wikipedia.org での使用状況
- pt.wikipedia.org での使用状況
- ro.wikipedia.org での使用状況
- ru.wikipedia.org での使用状況
- zh.wikipedia.org での使用状況