
ファイル:1982- Deaths from mass shootings in the U.S - scatterplot and line chart.svg

この SVG ファイルのこの PNG プレビューのサイズ: 800 × 600 ピクセル. その他の解像度: 320 × 240 ピクセル | 640 × 480 ピクセル | 1,024 × 768 ピクセル | 1,280 × 960 ピクセル | 2,560 × 1,920 ピクセル | 1,000 × 750 ピクセル。
元のファイル (SVG ファイル、1,000 × 750 ピクセル、ファイルサイズ: 4キロバイト)
ウィキメディア・コモンズのファイルページにある説明を、以下に表示します。
|
概要
| 解説 |
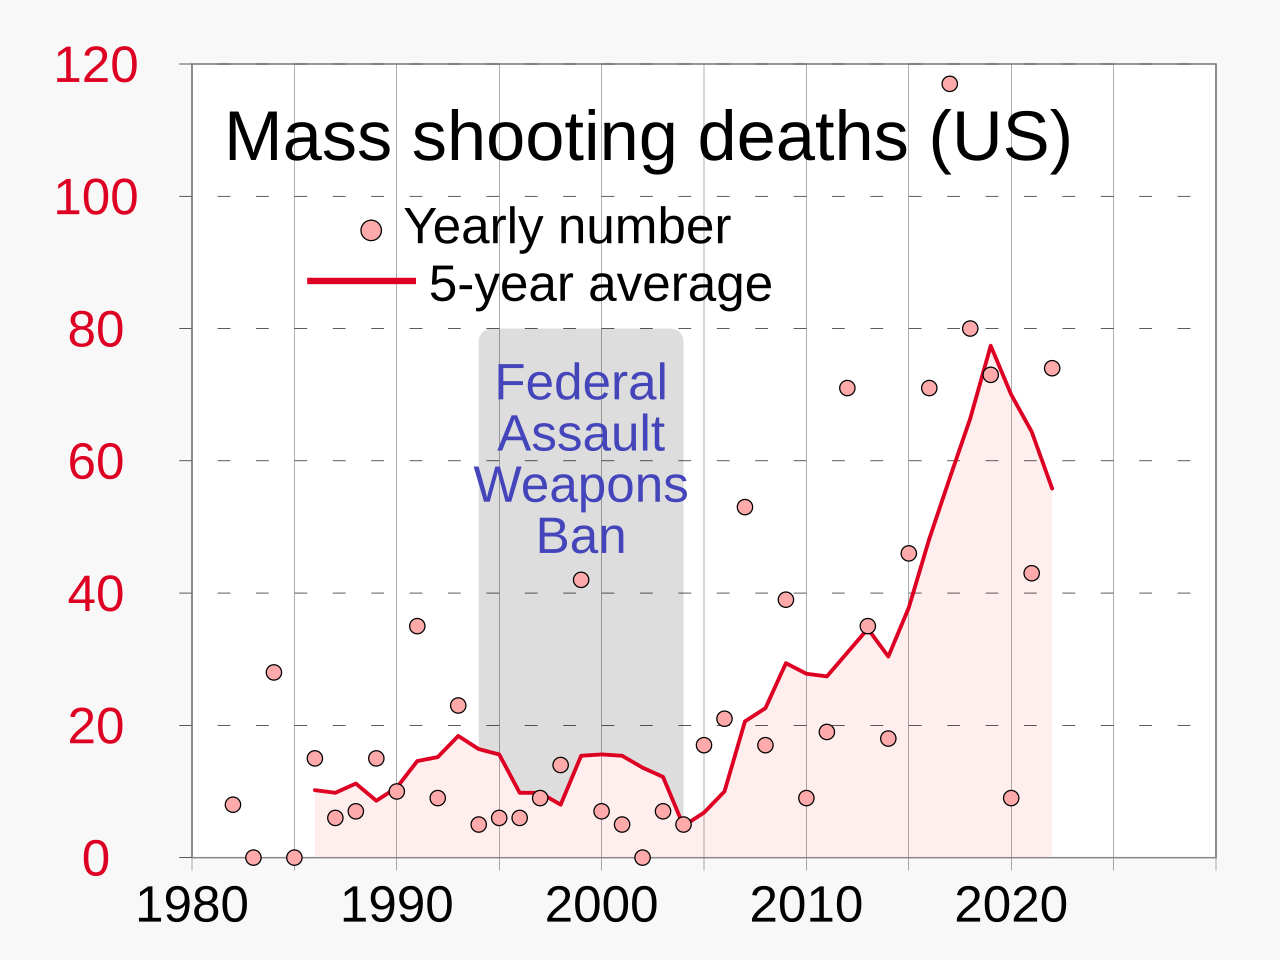
English: Chart showing deaths from mass shootings in the U.S., including 5-year moving average, beginning in 1982
|
||
| 日付 | |||
| 原典 | 投稿者自身による著作物 | ||
| 作者 | RCraig09 |

Related files
-
 Predecessor PNG file
 -
 Predecessor JPG file


ライセンス
この作品の著作権者である私は、この作品を以下のライセンスで提供します。
このファイルはクリエイティブ・コモンズ 表示-継承 4.0 国際ライセンスのもとに利用を許諾されています。
- あなたは以下の条件に従う場合に限り、自由に
- 共有 – 本作品を複製、頒布、展示、実演できます。
- 再構成 – 二次的著作物を作成できます。
- あなたの従うべき条件は以下の通りです。
- 表示 – あなたは適切なクレジットを表示し、ライセンスへのリンクを提供し、変更があったらその旨を示さなければなりません。これらは合理的であればどのような方法で行っても構いませんが、許諾者があなたやあなたの利用行為を支持していると示唆するような方法は除きます。
- 継承 – もしあなたがこの作品をリミックスしたり、改変したり、加工した場合には、あなたはあなたの貢献部分を元の作品とこれと同一または互換性があるライセンスの下に頒布しなければなりません。
ファイルの履歴
過去の版のファイルを表示するには、その版の日時をクリックしてください。
| 日付と時刻 | サムネイル | 寸法 | 利用者 | コメント | |
|---|---|---|---|---|---|
| 現在の版 | 2023年4月4日 (火) 04:47 | | 1,000 × 750 (4キロバイト) | RCraig09 | Version 3: add to legend |
| 2023年4月2日 (日) 03:46 |  | 1,000 × 750 (4キロバイト) | RCraig09 | Version 2: reduce thickness of line trace to be less dominant (compatible with related charts) | |
| 2023年3月31日 (金) 21:43 |  | 1,000 × 750 (4キロバイト) | RCraig09 | Uploaded own work with UploadWizard |
ファイルの使用状況
以下のページがこのファイルを使用しています:
グローバルなファイル使用状況
以下に挙げる他のウィキがこの画像を使っています:
- cy.wikipedia.org での使用状況
- en.wikipedia.org での使用状況
- en.wikiquote.org での使用状況
- es.wikipedia.org での使用状況
- fr.wikipedia.org での使用状況
- he.wikipedia.org での使用状況
- id.wikipedia.org での使用状況
- it.wikipedia.org での使用状況
- pl.wikipedia.org での使用状況
- pt.wikipedia.org での使用状況
- ru.wikipedia.org での使用状況
- vi.wikipedia.org での使用状況
- zh.wikipedia.org での使用状況