ファイル:Ukrainian parliamentary election, 2007 (SwingByRegion).PNG

ページのコンテンツが他言語でサポートされていません。

Ukrainian_parliamentary_election,_2007_(SwingByRegion).PNG(767 × 477 ピクセル、ファイルサイズ: 16キロバイト、MIME タイプ: image/png)

概要

解説
日付
原典 Self-made based off map by Muumi with data from Central Election Commission of Ukraine
作者 User:DemocracyATwork
許可
(ファイルの再利用)
w:ja:クリエイティブ・コモンズ
表示 継承
このファイルはクリエイティブ・コモンズ 表示-継承 1.0 一般ライセンスのもとに利用を許諾されています。
帰属: DemocracyATwork
あなたは以下の条件に従う場合に限り、自由に
  • 共有 – 本作品を複製、頒布、展示、実演できます。
  • 再構成 – 二次的著作物を作成できます。
あなたの従うべき条件は以下の通りです。
  • 表示 – あなたは適切なクレジットを表示し、ライセンスへのリンクを提供し、変更があったらその旨を示さなければなりません。これらは合理的であればどのような方法で行っても構いませんが、許諾者があなたやあなたの利用行為を支持していると示唆するような方法は除きます。
  • 継承 – If you alter, transform, or build upon this work, you must distribute the resulting work under the same license as the original.
その他のバージョン

Collection

Results of the parliamentary elections:
Politcal alignment 2007
Vote percenatge 2006 to 2007 (Top Six parties)
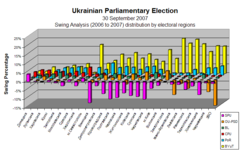
Swing 2006 to 2007 (Top Six parties)

Regional Analysis of the parliamentary elections:

Highest Vote per region
Charts showing the top six parties support - percentage of total national vote and Electoral Region
Vote Percentage by Electoral Region Vote Percentage by Electoral Region Swing by Electoral Regions
Maps showing the top six parties support - percentage of total national vote
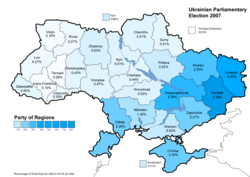
Party of Regions results (34.37%)
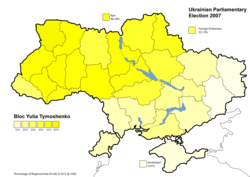
Bloc Yulia Tymoshenko results (30.71%
Our Ukraine People's Self-Defence results (14.15%)
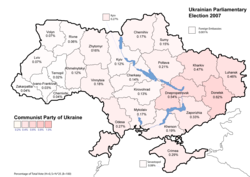
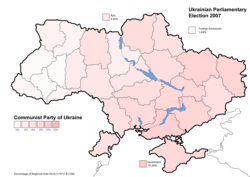
Communist Party of Ukraine results (5.39%)
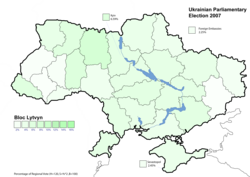
Bloc Lytvyn Party results (3.96%)
Socialist Party of Ukraine results (2.86%)
Maps showing the top six parties support - percentage of total national vote (Minimal text)
Party of Regions results (34.37%)
Bloc Yulia Tymoshenko results (30.71%
Our Ukraine People's Self-Defence results (14.15%)
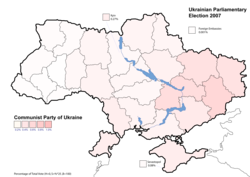
Communist Party of Ukraine results (5.39%)
Bloc Lytvyn Party results (3.96%)
Socialist Party of Ukraine results (2.86%)
Maps showing the top six parties support - percentage per region
Party of Regions results (34.37%)
Bloc Yulia Tymoshenko results (30.71%
Our Ukraine People's Self-Defence results (14.15%)
Communist Party of Ukraine results (5.39%)
Bloc Lytvyn Party results (3.96%)
Socialist Party of Ukraine results (2.86%)


2007 [1] [2] [3] [4] [5] [6]

2006 [7] [8] [9] [10] [11] [12]

A swing analysis is common in any election. It shows the change in voter percentage for each party by regions from 2006 to 2007.

ライセンス

Public domain この著作物の著作権者である私は、この著作物における権利を放棄しパブリックドメインとします。これは全世界で適用されます。
一部の国では、これが法的に可能ではない場合があります。その場合は、次のように宣言します。
私は、あらゆる人に対して、法により必要とされている条件を除き、如何なる条件も課すことなく、あらゆる目的のためにこの著作物を使用する権利を与えます。
  1. Template:Cite gov
  2. Template:Cite gov
  3. Template:Cite gov
  4. Template:Cite gov
  5. Template:Cite gov
  6. Template:Cite gov
  7. Template:Cite gov
  8. Template:Cite gov
  9. Template:Cite gov
  10. Template:Cite gov
  11. Template:Cite gov
  12. Template:Cite gov

キャプション

このファイルの内容を1行で記述してください

このファイルに描写されている項目

題材

11 2 2008

ファイルの履歴

過去の版のファイルを表示するには、その版の日時をクリックしてください。

日付と時刻サムネイル寸法利用者コメント
現在の版2008年2月20日 (水) 17:072008年2月20日 (水) 17:07時点における版のサムネイル767 × 477 (16キロバイト)DemocracyATworkUkrainian Parliamentary Election 2007 Results of election (Political Swing by region) chart. Removed boarder.
2008年2月17日 (日) 23:102008年2月17日 (日) 23:10時点における版のサムネイル748 × 477 (16キロバイト)DemocracyATworkUpdate to reflect color change for Bloc Lytvyn to match with the Parliamentary seat allocation map. From grey to geen.
2008年2月13日 (水) 14:242008年2月13日 (水) 14:24時点における版のサムネイル748 × 477 (16キロバイト)DemocracyATwork== Summary == {{Information |Description='''English:''' Ukrainian parliamentary election, 2007 sorted to better correlate to data table. |Source=Self-made based off [[:Image:Wahlkreise ukraine 2006 eng.png|ma
2008年2月6日 (水) 14:362008年2月6日 (水) 14:36時点における版のサムネイル748 × 477 (19キロバイト)File Upload Bot (Magnus Manske) {{BotMoveToCommons|uk.wikipedia}} {{Information |Description={{uk|uk:?????????:?????????? 2007 http://www.cvk.gov.ua/pls/vnd2007/W6P320?PT001F01=600&pPlace=1 http://www.cvk.gov.ua/pls/vnd2007/W6P320?PT001F01=600&pPlace=2 http://www.c

以下のページがこのファイルを使用しています:

グローバルなファイル使用状況

以下に挙げる他のウィキがこの画像を使っています: