
ファイル:Atmospheric carbon dioxide concentrations and global annual average temperatures over the years 1880 to 2009.png

このプレビューのサイズ: 751 × 599 ピクセル。 その他の解像度: 301 × 240 ピクセル | 602 × 480 ピクセル | 963 × 768 ピクセル | 1,198 × 956 ピクセル。
元のファイル (1,198 × 956 ピクセル、ファイルサイズ: 80キロバイト、MIME タイプ: image/png)
ウィキメディア・コモンズのファイルページにある説明を、以下に表示します。
|
概要
| 解説 |
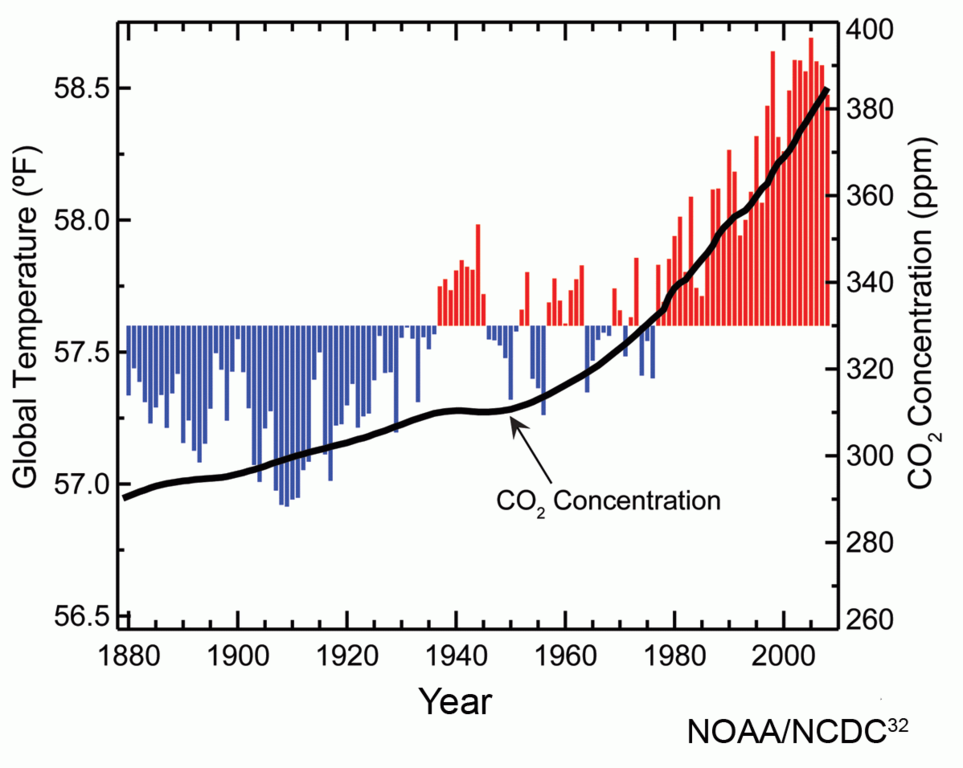
English: "Global annual average temperature (as measured over both land and oceans). Red bars indicate temperatures above and blue bars indicate temperatures below the average temperature for the period 1901-2000. The black line shows atmospheric carbon dioxide (CO2) concentration in parts per million (ppm). While there is a clear long-term global warming trend, each individual year does not show a temperature increase relative to the previous year, and some years show greater changes than others. [...] These year-to-year fluctuations in temperature are due to natural processes, such as the effects of El Niños, La Niñas, and the eruption of large volcanoes." Source: page 17 of the report, using print version page numbering. |
|||
| 日付 | ||||
| 原典 | Taken from page 17 (print version page numbering) of the chapter "Global Climate Change" in the report: "Global Climate Change Impacts in the United States." Freely accessible on the web from the United States Global Change Research Program. Also available in print from Cambridge University Press, 32 Avenue of the Americas, New York, NY 10013-2473, USA:. ISBN 978-0-521-14407-0 | |||
| 作者 | The source for the diagram given in the report is NOAA/NCDC. The editors of the report were Thomas R. Karl, Jerry M. Melillo, and Thomas C. Peterson. | |||
| 許可 (ファイルの再利用) |
The text of the report is in the public domain - see the opening pages of the PDF version of the full report. The diagram itself was produced by NOAA/NCDC: "As required by 17 U.S.C. 403, third parties producing copyrighted works consisting predominantly of the material produced by U.S. government agencies must provide notice with such work(s) identifying the U.S. Government material incorporated and stating that such material is not subject to copyright protection within the United States. The information on government web pages is in the public domain and not subject to copyright protection within the United States unless specifically annotated otherwise (copyright may be held elsewhere). Foreign copyrights may apply." http://www.ngdc.noaa.gov/ngdcinfo/privacy.html | |||
| その他のバージョン |
|


ライセンス
|
|
my nameis sommmi
ファイルの履歴
過去の版のファイルを表示するには、その版の日時をクリックしてください。
| 日付と時刻 | サムネイル | 寸法 | 利用者 | コメント | |
|---|---|---|---|---|---|
| 現在の版 | 2011年7月2日 (土) 16:34 | | 1,198 × 956 (80キロバイト) | Enescot | {{Information |Description ={{en|1="Global annual average temperature (as measured over both land and oceans). Red bars indicate temperatures above and blue bars indicate temperatures below the average temperature for the period 1901-2000. The black li |
ファイルの使用状況
以下のページがこのファイルを使用しています: