
バーンズリーのシダ

バーンズリーのシダ(Barnsley fern)は、イギリスの数学者マイケル・バーンズリーにちなんで名付けられたフラクタルで、その著書『Fractals Everywhere』で初めて記述された[1]。チャセンシダの1種であるミヤマカワリシダ(Asplenium adiantum-nigrum)を模したものである。
歴史[編集]
シダは、自己相似図形の代表例の1つである。すなわち、数学的に生成されたパターンであり、そのパターンは任意に拡大または縮小しても同一の形状が現れる自己相似性を示す。シェルピンスキーの三角形のように、バーンズリーのシダは、コンピューターで数式を繰り返し使用することで、視覚的に美しい図形を構築する方法を示している。バーンズリーの1988年の本『Fractals Everywhere』は、 ジョージア工科大学数学部のフラクタル幾何学と呼ばれるコースにおける学部生と大学院生に対する講義内容に基づいている。この本の出版後、フラクタル測定理論と呼ばれる第二のコースが設置された[1]。バーンズリーの作品は、数学モデルで自然を模倣しようとするグラフィックアーティストのインスピレーションの源となっている。

バーンズリーによって開発されたシダのコードは、フラクタルを作成するための反復関数系(IFS:Iterated Function System)の例である。これはコラージュ定理に従う。彼はフラクタルを使用して、科学技術におけるさまざまな現象、とりわけ植物構造、についてモデル化している。
IFSは、自然の分岐構造でしばしば発生する自己相似性により、特定の植物、葉、およびシダのモデルを提供する。しかし、自然は、あるレベルから次のレベルへのランダム性と変化も示す。2つのシダはまったく同じではなく、枝分かれしている大きな葉は小さなスケールでは小さい葉になる。V変数フラクタルは、スケール全体でこのようなランダム性と変動性を許容すると同時に、幾何学的モデリングを容易にするパラメーターへの連続的な依存性が認められる。これらの要因により、ハイブリッド生物学モデルを作成できる......特定の植物の幾何学によく一致するV変数の幾何学的フラクタルモデルが見つかった場合、これらの符号樹と植物の遺伝子に格納されている情報の間に特定の関係があると推測される。
—マイケル・バーンズリーら
シダの生成[編集]

バーンズリーのシダは、4つのアフィン変換を使用する。変換の式は次のとおりである。

あるいは

バーンズリーは、前述した著書で、シダを生成するIFSコードを、以下の表のように、値の行列の形で示した[2]。下表では、列「a」から「f」は前記の等式f(x,y)の係数を示しており、「p」はそれぞれの値の組に対する確率因子を表している。
| w | a | b | c | d | e | f | p | 生成する部分 |
|---|---|---|---|---|---|---|---|---|
| ƒ1 | 0 | 0 | 0 | 0.16 | 0 | 0 | 0.01 | シダの茎 |
| ƒ2 | 0.85 | 0.04 | −0.04 | 0.85 | 0 | 1.60 | 0.85 | 連続する小さい葉 |
| ƒ3 | 0.20 | −0.26 | 0.23 | 0.22 | 0 | 1.60 | 0.07 | 左側の大きな葉 |
| ƒ4 | −0.15 | 0.28 | 0.26 | 0.24 | 0 | 0.44 | 0.07 | 右側の大きな葉 |
上記の表は、次の4つの変換に対応している。


コンピューターによる生成[編集]

バーンズリーのシダは、理論的にはペンとグラフ用紙を使用して手でプロットできるが、必要な反復回数は数万回に達するので、実際にはコンピューターを使用する必要がある。バーンズリーのシダの多くのさまざまな計算モデルは、現代の数学者に人気がある。バーンズリーの係数行列を使用し、数式が正しくプログラムされている限り、同じ形状をもったシダが生成される。
最初に描画される点は原点( x 0 = 0、 y 0 = 0)にあり、次の4つの座標変換ƒ1, ƒ2, ƒ3, ƒ4のいずれかを設定した発生確率pでランダムに適用することにより、新しい点を反復的に計算する[3] [4]。すなわち、どの座標変換を使用するか確率に応じた乱数範囲を設定しておき、コンピューターで乱数を発生させ、乱数の値に応じてどの座標変換を使用するのか決め、変換計算を反復的に実行する。これは、1988年にバーンズリーがランダム・アルゴリズムと名付けた初めての例であり[1]、現在ではカオスゲーム[5]、確率論的反復関数系[6]とも呼ばれている。
ƒ1
- x n + 1 = 0
- y n + 1 = 0.16 y n 。
座標変換ƒ1は1%の確率(p=0.01)で実行される。この変換は、任意の点を、シダの茎基部の最初の線分にマッピングするだけである。フラクタル図のこの部分は、反復の過程で最初に完了する部分である。
ƒ2
- x n + 1 = 0.85 x n + 0.04 y n
- y n + 1 = −0.04 x n + 0.85 y n + 1.6。
この座標変換ƒ2は、85%の確率(p=0.85)で実行され、図の赤い三角形で表される葉の中の任意のポイントを、青い三角形で表される反対側の小さな葉の中の点にマッピングする。
ƒ3
- x n + 1 = 0.2 x n − 0.26 y n
- y n + 1 = 0.23 x n + 0.22 y n + 1.6。
この座標変換ƒ3は、7%の確率(p=0.07)で実行され、青い三角形で表される葉(または羽片)の中の任意の点を、茎を交差し交互に対応する三角形内にマッピングする(反転する)。
ƒ4
- x n + 1 = −0.15 x n + 0.28 y n
- y n + 1 = 0.26 x n + 0.24 y n + 0.44。
この座標変換ƒ4は、7%の確率(p=0.07)で実行され、青い三角形で表される葉(または羽片)の中の任意の点を、茎を交差し交互に対応する三角形内にマッピングする(反転せずに)。
最初の座標変換は茎を描画する。2番目は茎と下葉を連続コピーして、完全なシダを生成する。3番目は左下葉を描き、4番目は、右下の葉を描く。IFSの再帰的な性質により、全体が各葉の部分の大きな複製となっている。シダ全体が-2.1820 < x < 2.6558 および 0 ≤ y < 9.9983 の範囲内にあることに注意。
様々なシダの変種[編集]


係数をいろいろと変えることで、様々なシダの品種、変種を作成することが可能である。V変数フラクタルに関する彼の論文において、バーンズリーはこの特性をスーパーフラクタルと呼んでいる。
ある実験者は係数の表を作成して、CyclosolusまたはThelypteridaceaeシダに類似した、非常に自然に見える別のシダを作成した(下表に示す)[7] [8]。
| w | a | b | c | d | e | f | p |
|---|---|---|---|---|---|---|---|
| ƒ1 | 0 | 0 | 0 | 0.25 | 0 | −0.4 | 0.02 |
| ƒ2 | 0.95 | 0.005 | −0.005 | 0.93 | −0.002 | 0.5 | 0.84 |
| ƒ3 | 0.035 | −0.2 | 0.16 | 0.04 | −0.09 | 0.02 | 0.07 |
| ƒ4 | −0.04 | 0.2 | 0.16 | 0.04 | 0.083 | 0.12 | 0.07 |
構文例[編集]
以下の各プログラム言語の構文を使用して、シダを自分で描くことができる。
Python[編集]
import turtle
import random

pen = turtle.Turtle()
pen.speed(20)
pen.color('green')
pen.penup()

x = 0
y = 0
for n in range(100000):
    pen.goto(85*x, 57*y-275)  # 57 is to scale the fern and -275 is to start the drawing from the bottom.
    pen.pendown()
    pen.dot()
    pen.penup()
    r = random.random()  # to get probability
    r = r * 100
    xn = x
    yn = y
    if r < 1:  # elif ladder based on the probability
        x = 0
        y = 0.16 * yn
    elif r < 86:
        x = 0.85 * xn + 0.04 * yn
        y = -0.04 * xn + 0.85 * yn + 1.6
    elif r < 93:
        x = 0.20 * xn - 0.26 * yn
        y = 0.23 * xn + 0.22 * yn + 1.6
    else:
        x = -0.15 * xn + 0.28 * yn
        y = 0.26 * xn + 0.24 * yn + 0.44
R[編集]
# Barnsley's Fern

# create function of the probability and the current point
fractal_fern2 <- function(x, p){
  if (p <= 0.01) {
    m <- matrix(c(0, 0, 0, .16), 2, 2)
    f <- c(0, 0)
  } else if (p <= 0.86) {
    m <- matrix(c(.85, -.04, .04, .85), 2, 2)
    f <- c(0, 1.6)
  } else if (p <= 0.93) {
    m <- matrix(c(.2, .23, -.26, .22), 2, 2)
    f <- c(0, 1.6)
  } else {
    m <- matrix(c(-.15, .26, .28, .24), 2, 2)
    f <- c(0, .44)
  }
  m %*% x + f
}

# how many reps determines how detailed the fern will be
reps <- 10000

# create a vector with probability values, and a matrix to store coordinates
p <- runif(reps)

# initialise a point at the origin
coords <- c(0, 0)

# compute Fractal Coordinates
m <- Reduce(fractal_fern2, p, accumulate = T, init = coords)
m <- t(do.call(cbind, m))

# Create plot
plot(m, type = "p", cex = 0.1, col = "darkgreen",
     xlim = c(-3, 3), ylim = c(0, 10),
     xlab = NA, ylab = NA, axes = FALSE)
Processing[編集]
/*
    Barnsley Fern for Processing 3.4
*/

// declaring variables x and y
float x, y;

// creating canvas
void setup() {
  size(600, 600);
  background(255);
}

/* setting stroke,  mapping canvas and then
   plotting the points */
void drawPoint() {
  stroke(34, 139, 34);
  strokeWeight(1);
  float px = map(x, -2.1820, 2.6558, 0, width);
  float py = map(y, 0, 9.9983, height, 0);
  point(px, py);
}

/* algorithm for calculating value of (n+1)th
   term of x and y based on the transformation
   matrices */
void nextPoint() {
  float nextX, nextY;
  float r = random(1);
  if (r < 0.01) {
    nextX =  0;
    nextY =  0.16 * y;
  } else if (r < 0.86) {
    nextX =  0.85 * x + 0.04 * y;
    nextY = -0.04 * x + 0.85 * y + 1.6;
  } else if (r < 0.93) {
    nextX =  0.20 * x - 0.26 * y;
    nextY =  0.23 * x + 0.22 * y + 1.6;
  } else {
    nextX = -0.15 * x + 0.28 * y;
    nextY =  0.26 * x + 0.24 * y + 0.44;
  }
  x = nextX;
  y = nextY;
}

/* iterate the plotting and calculation
   functions over a loop */
void draw() {
  for (int i = 0; i < 100; i++) {
    drawPoint();
    nextPoint();
  }
}
P5.JS[編集]
let x = 0;
let y = 0;

function setup() {
 createCanvas(600, 600);
 background(0);
}

//range −2.1820 < x < 2.6558 and 0 ≤ y < 9.9983.
function drawPoint() {
 stroke(255);
 strokeWeight(1);
 let px = map(x, -2.1820, 2.6558, 0, width);
 let py = map(y, 0, 9.9983, height, 0);
 point(px, py);
}

function nextPoint() {
 let nextX;
 let nextY;

 let r = random(1);

 if (r < 0.01) {
  //1
  nextX = 0;
  nextY = 0.16 * y;
 } else if (r < 0.86) {
  //2
  nextX = 0.85 * x + 0.04 * y;
  nextY = -0.04 * x + 0.85 * y + 1.60;
 } else if (r < 0.93) {
  //3
  nextX = 0.20 * x + -0.26 * y;
  nextY = 0.23 * x + 0.22 * y + 1.60;
 } else {
  //4
  nextX = -0.15 * x + 0.28 * y;
  nextY = 0.26 * x + 0.24 * y + 0.44;
 }

 x = nextX;
 y = nextY;
}

function draw() {
 for (let i = 0; i < 1000; i++) {
  drawPoint();
  nextPoint();
 }
}
JavaScript (HTML5)[編集]
<canvas id="canvas" height="700" width="700">
</canvas>

<script>
    let canvas;
    let canvasContext;

    let move;

    let fps = 250;

    let pointColor = "green";
    let backgroundColor = "black";
    let pointRadius = 1;

    let x = 0;
    let y = 0;

    window.onload = function () {
        canvas = document.getElementById("canvas");
        canvasContext = canvas.getContext('2d');

        canvasContext.fillStyle = backgroundColor;
        canvasContext.fillRect(0, 0, canvas.width, canvas.height);

        move = setInterval(doIt, 1000/fps);
    };

    let doIt = function () {
        for (let i = 0; i < 20; i++)
            moveAll()
    };

    function moveAll() {

        let nextX, nextY;
        let r = Math.random();
        if (r < 0.01) {
            nextX =  0;
            nextY =  0.16 * y;
        } else if (r < 0.86) {
            nextX =  0.85 * x + 0.04 * y;
            nextY = -0.04 * x + 0.85 * y + 1.6;
        } else if (r < 0.93) {
            nextX =  0.20 * x - 0.26 * y;
            nextY =  0.23 * x + 0.22 * y + 1.6;
        } else {
            nextX = -0.15 * x + 0.28 * y;
            nextY =  0.26 * x + 0.24 * y + 0.44;
        }

        // Scaling and positioning
        let plotX = canvas.width * (x + 3) / 6;
        let plotY = canvas.height - canvas.height * ((y + 2) / 14);

        drawFilledCircle(plotX, plotY, pointRadius, pointColor);

        x = nextX;
        y = nextY;

    }
    const drawFilledCircle = (centerX, centerY, radius, color) => {
        canvasContext.beginPath();
        canvasContext.fillStyle = color;
        canvasContext.arc(centerX, centerY, radius, 0, 2 * Math.PI, true);
        canvasContext.fill();
    };
</script>
QBasic[編集]
SCREEN 12
WINDOW (-5, 0)-(5, 10)
RANDOMIZE TIMER
COLOR 10
DO
    SELECT CASE RND
        CASE IS < .01
            nextX = 0
            nextY = .16 * y
        CASE .01 TO .08
            nextX = .2 * x - .26 * y
            nextY = .23 * x + .22 * y + 1.6
        CASE .08 TO .15
            nextX = -.15 * x + .28 * y
            nextY = .26 * x + .24 * y + .44
        CASE ELSE
            nextX = .85 * x + .04 * y
            nextY = -.04 * x + .85 * y + 1.6
    END SELECT
    x = nextX
    y = nextY
    PSET (x, y)
LOOP UNTIL INKEY$ = CHR$(27)
VBA(CorelDraw)[編集]
Sub Barnsley()

Dim iEnd As Long
Dim i As Long
Dim x As Double
Dim y As Double
Dim nextX As Double
Dim nextY As Double
Dim sShapeArray() As Shape
Dim dSize As Double
Dim sColor As String


    dSize = 0.01        ' Size of the dots
    sColor = "0,0,100"  ' RGB color of dots, value range 0 to 255
    iEnd = 5000       ' Number of iterations
    ReDim sShapeArray(iEnd)
                        ' In Corel, each object drawn requires a variable name of its own

    Randomize           ' Initialize the Rnd function

    For i = 0 To iEnd   ' Iterate ...
        Select Case Rnd
            Case Is < 0.01
                        ' f1 = Draw stem
                nextX = 0
                nextY = 0.16 * y
            Case 0.01 To 0.08
                        ' f3
                nextX = 0.2 * x - 0.26 * y
                nextY = 0.23 * x + 0.22 * y + 1.6
            Case 0.08 To 0.15
                        ' f4
                nextX = -0.15 * x + 0.28 * y
                nextY = 0.26 * x + 0.24 * y + 0.44
            Case Else
                        ' f2
                nextX = 0.85 * x + 0.04 * y
                nextY = -0.04 * x + 0.85 * y + 1.6
        End Select
        x = nextX
        y = nextY
        Set sShapeArray(i) = ActiveLayer.CreateEllipse2(x + 2.5, y + 0.5, dSize)
        sShapeArray(i).Style.StringAssign "{""fill"":{""primaryColor"":""RGB255,USER," & sColor & ",100,00000000-0000-0000-0000-000000000000"",""secondaryColor"":""RGB255,USER,255,255,255,100,00000000-0000-0000-0000-000000000000"",""type"":""1"",""fillName"":null},""outline"":{""width"":""0"",""color"":""RGB255,USER,0,0,0,100,00000000-0000-0000-0000-000000000000""},""transparency"":{}}"
        DoEvents
    Next

 End Sub
Amola[編集]
addpackage("Forms.dll")

set("x", 0)
set("y", 0)
set("width", 600)
set("height", 600)

method setup()
	createCanvas(width, height)
	rect(0, 0, 600, 600, color(0, 0, 0))
end

method drawPoint()
    set("curX", div(mult(width, add(x, 3)), 6))
    set("curY", sub(height, mult(height, div(add(y, 2), 14))))
    set("size", 1)
	//log(curX)
	//log(curY)
	rect(round(curX - size / 2), round(curY - size / 2), round(curX + size / 2), round(curY + size / 2), color(34, 139, 34))
end

method nextPoint()
	set("nextX", 0)
	set("nextY", 0)
	set("random", random(0, 100))
	if(random < 1)
		set("nextX", 0)
		set("nextY", 0.16 * y)
	end
	else
		if(random < 86)
			set("nextX", 0.85 * x + 0.04 * y)
			set("nextY", -0.04 * x + 0.85 * y + 1.6)
		end
		else
			if(random < 93)
				set("nextX", 0.2 * x - 0.26 * y)
				set("nextY", 0.23 * x + 0.22 * y + 1.6)
			end
			else
				set("nextX", -0.15 * x + 0.28 * y)
				set("nextY", 0.26 * x + 0.24 * y + 0.44)
			end
		end
	end

	set("x", nextX)
	set("y", nextY)
end

setup()
while(true)
	drawPoint()
	nextPoint()
end
表計算ソフトによる計算例[編集]
プログラム言語の構文と同じ計算を、以下のように表計算ソフトの関数を使用することでも実現できる。

| A | B | C | D | E | F | G | H | |
|---|---|---|---|---|---|---|---|---|
| 1 | w | a | b | c | d | e | f | p |
| 2 | ƒ1 | 0 | 0 | 0 | 0.16 | 0 | 0 | 0.01 |
| 3 | ƒ2 | 0.85 | 0.04 | -0.04 | 0.85 | 0 | 1.6 | 0.85 |
| 4 | ƒ3 | 0.2 | -0.26 | 0.23 | 0.22 | 0 | 1.6 | 0.07 |
| 5 | ƒ4 | -0.15 | 0.28 | 0.26 | 0.24 | 0 | 0.44 | 0.07 |
| 6 | random | ƒ | X | Y | ||||
| 7 | 0 | 0 | ←initial | |||||
| 8 | =RAND() | B8 | C8 | D8 | ←data |
なお、B8,C8,D8のセルには以下のような複数条件判定の関数(ネスティング参照)を入力する。
- B8=IF(A8<($H$2),1,IF(A8<($H$2+$H$3),2,IF(A8<($H$2+$H$3+$H$4),3,4)))
- C8=IF(B8=1,$B$2*C7+$C$2*D7+$F$2,IF(B8=2,$B$3*C7+$C$3*D7+$F$3,IF(B8=3,$B$4*C7+$C$4*D7+$F$4,$B$5*C7+$C$5*D7+$F$5)))
- D8=IF(B8=1,$D$2*C7+$E$2*D7+$G$2,IF(B8=2,$D$3*C7+$E$3*D7+$G$3,IF(B8=3,$D$4*C7+$E$4*D7+$G$4,$D$5*C7+$E$5*D7+$G$5)))
最終8行目をオートフィルで適当な行数だけコピーし、XY散布図とするとバーンズリーのシダのフラクタル図が得られる。各変換式ƒの係数a,b,c,d,e,fと確率pは任意に変更可能である。
各列は以下のような計算を行っている。
- A列 乱数を発生させる。
- B列 乱数をもとに確率pに応じた条件判定を行い、用いる変換ƒを決める。
- C列 先に決めた変換ƒに対応する計算をおこない、Xを求める。
- D列 先に決めた変換ƒに対応する計算をおこない、Yを求める。
- 新たなXとYは前の行のXとYの値を使用し、反復的に計算を進める。
脚注[編集]
- ^ a b c Fractals Everywhere, Boston, MA: Academic Press, 1993, ISBN 0-12-079062-9
- ^ Fractals Everywhere, table III.3, IFS code for a fern.
- ^ Barnsley, Michael (2000). Fractals everywhere. Morgan Kaufmann. pp. 86. ISBN 0-12-079069-6 2010年1月7日閲覧。
- ^ Weisstein. “Barnsley's Fern”. 2010年1月7日閲覧。
- ^ Weisstein, Eric W.. “Chaos Game” (英語). mathworld.wolfram.com. 2020年2月20日閲覧。
- ^ “カオスゲーム”. www.gifu-nct.ac.jp. 2020年2月20日閲覧。
- ^ Other fern varieties with supplied coefficients, retrieved 2010-1-7
- ^ A Barnsley fern generator
| 特徴 | 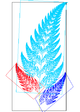 | |
|---|---|---|
| 反復関数系 | ||
| ストレンジアトラクター | ||
| L-system | ||
| Escape-time fractals | ||
| 確率的フラクタル | ||
| 人物 | ||
| その他 | ||
|
| ||