
ファイル:Table isotopes en.svg

この SVG ファイルのこの PNG プレビューのサイズ: 419 × 600 ピクセル. その他の解像度: 168 × 240 ピクセル | 335 × 480 ピクセル | 537 × 768 ピクセル | 715 × 1,024 ピクセル | 1,431 × 2,048 ピクセル | 580 × 830 ピクセル。
元のファイル (SVG ファイル、580 × 830 ピクセル、ファイルサイズ: 215キロバイト)
ウィキメディア・コモンズのファイルページにある説明を、以下に表示します。
|
概要
| 解説 |
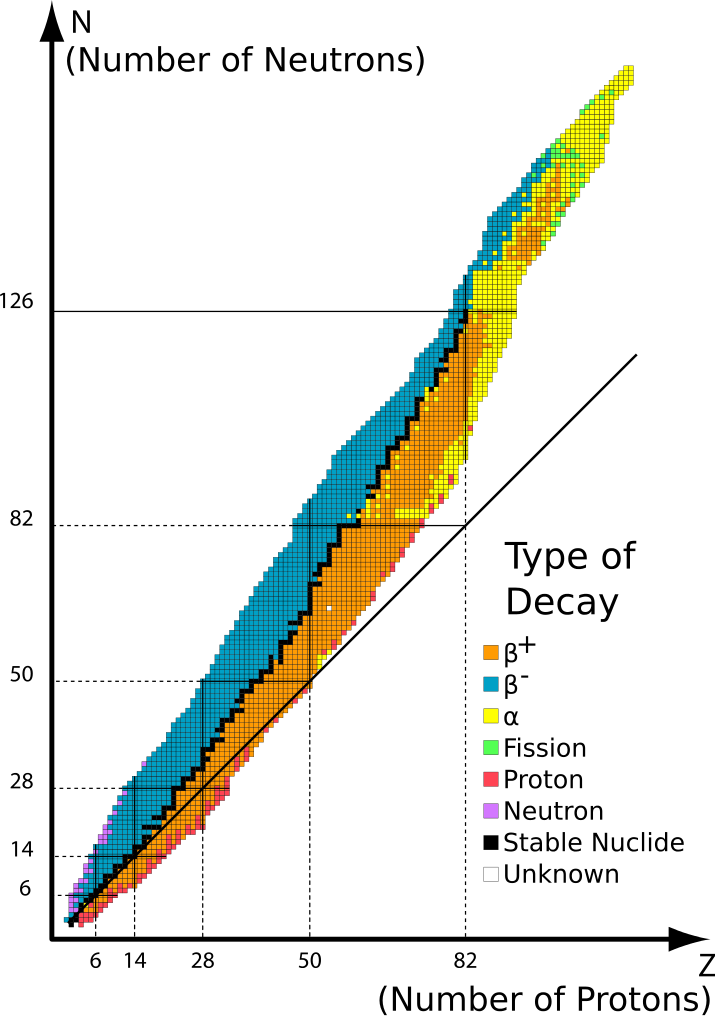
Deutsch: Auftragung von Isotopen nach Art des radioaktiven Zerfalls. Orange und blaue Nuklide sind instabil, schwarze Kästen dazwischen zeigen stabile Nuklide. Die durchgezogene Linie repräsentiert die theoretische Position der Nuklide bei der Protonen- und Neutronenanzahl identisch sind. Es zeigt sich, dass Elemente mit mehr als 20 Protonen mehr Neutronen benötigen um stabil zu sein.
English: Graph of isotopes by type of nuclear decay. Orange and blue nuclides are unstable, with the black squares between these regions representing stable nuclides. The unbroken line passing below many of the nuclides represents the theoretical position on the graph of nuclides for which proton number is the same as neutron number. The graph shows that elements with more than 20 protons must have more neutrons than protons, in order to be stable.
Français : Table des isotopes par type de désintégration majoritaire, convertie depuis les données du programme Nucleus. |
| 日付 | (UTC) |
| 原典 | |
| 作者 |
|
| その他のバージョン |
このファイルの派生的著作物: []
|


|
このSVG imageファイルのサイズは特例的に大きい原因として、文章のほとんどもしくは全てを一般的な
<text>タグではなく、paths (パス) に変換されたためです。SVG ファイル内の文字列を処理すると技術的な制約を受けて手のほどこしようがないほど判読不能になる場合を除き、文字列を平文に戻すよう強く推奨されます。その作業をしたファイルは、他言語への翻訳が楽にでき、またファイルサイズを大幅に小さくできる可能性があります。文字列をパス処理した SVG ファイルはCategory:Path text SVG にまとめてあります。詳細はSVG: Fonts および Commons:アップロード前の画像の準備#画像中の文字列をご参照ください。
|

|
ライセンス
この作品の著作権者である私は、この作品を以下のライセンスで提供します。
- あなたは以下の条件に従う場合に限り、自由に
- 共有 – 本作品を複製、頒布、展示、実演できます。
- 再構成 – 二次的著作物を作成できます。
- あなたの従うべき条件は以下の通りです。
- 表示 – あなたは適切なクレジットを表示し、ライセンスへのリンクを提供し、変更があったらその旨を示さなければなりません。これらは合理的であればどのような方法で行っても構いませんが、許諾者があなたやあなたの利用行為を支持していると示唆するような方法は除きます。
- 継承 – もしあなたがこの作品をリミックスしたり、改変したり、加工した場合には、あなたはあなたの貢献部分を元の作品とこれと同一または互換性があるライセンスの下に頒布しなければなりません。

|
この文書は、フリーソフトウェア財団発行のGNUフリー文書利用許諾書 (GNU Free Documentation License) 1.2またはそれ以降のバージョンの規約に基づき、複製や再配布、改変が許可されます。不可変更部分、表紙、背表紙はありません。このライセンスの複製は、GNUフリー文書利用許諾書という章に含まれています。 |
あなたは上記のライセンスから、どれか一つ以上を選択できます。
元のアップロードログ
This image is a derivative work of the following images:
- File:Table_isotopes.svg licensed with Cc-by-sa-3.0,2.5,2.0,1.0, GFDL
- 2008-05-21T21:32:39Z Napy1kenobi 580x830 (617205 Bytes) Table des isotopes par type de désintégration majoritaire, convertie depuis les données du programme Nucleus, fond caché sous Inkscape retiré. [[Category:Chart of nuclides]] [[Category:Decay]]
- 2008-05-21T21:29:04Z Napy1kenobi 842x830 (1084210 Bytes) {{Information |Description=Table des isotopes par type de désintégration majoritaire, convertie depuis les données du programme Nucleus. |Source=travail personnel |Date=2008-05-21 |Author= [[User:Napy1kenobi|Napy1kenobi]]
Uploaded with derivativeFX
| 注釈 | この画像には注釈がついています: コモンズで注釈を見る |
ファイルの履歴
過去の版のファイルを表示するには、その版の日時をクリックしてください。
| 日付と時刻 | サムネイル | 寸法 | 利用者 | コメント | |
|---|---|---|---|---|---|
| 現在の版 | 2010年4月5日 (月) 02:18 | | 580 × 830 (215キロバイト) | Quibik | Made the source code more compact. |
| 2009年5月5日 (火) 09:25 |  | 580 × 830 (695キロバイト) | Sjlegg | {{Information |Description=Table of isotopes by type of nuclear decay. |Source=*File:Table_isotopes.svg |Date=2009-05-05 10:23 (UTC) |Author=*File:Table_isotopes.svg: Napy1kenobi *derivative work: ~~~ |Permission=see below |
ファイルの使用状況
以下のページがこのファイルを使用しています:
グローバルなファイル使用状況
以下に挙げる他のウィキがこの画像を使っています:
- az.wikipedia.org での使用状況
- beta.wikiversity.org での使用状況
- bn.wikipedia.org での使用状況
- ca.wikipedia.org での使用状況
- el.wikipedia.org での使用状況
- en.wikipedia.org での使用状況
- en.wikibooks.org での使用状況
- en.wikiversity.org での使用状況
- User:Marshallsumter/Keynote lectures (draft)/Geology
- Draft:Original research/Radiation
- User:Marshallsumter/Radiation astronomy/Electrons
- User:Marshallsumter/Radiation astronomy1/Positrons
- User:Marshallsumter/Keynote lectures (draft)/Neutron radiation astronomy
- User:Marshallsumter/Radiation astronomy1/Neutrinos
- User:Marshallsumter/Radiation astronomy2/Subatomics
- User:Marshallsumter/Radiation astronomy/Beta particles
- Draft:Original research/Nuclear physics
- Radiation/Neutrons
- User:Marshallsumter/Radiation astronomy2/Transmutations
- Charges/Nuclear physics
- Chemicals/Borons
- es.wikipedia.org での使用状況
- fa.wikipedia.org での使用状況
- fi.wikipedia.org での使用状況
- fr.wikipedia.org での使用状況
- he.wikipedia.org での使用状況
- hi.wikiversity.org での使用状況
- hr.wikipedia.org での使用状況
- hu.wikipedia.org での使用状況
- id.wikipedia.org での使用状況
- ms.wikipedia.org での使用状況
- pnb.wikipedia.org での使用状況
- sv.wikipedia.org での使用状況
- sv.wikibooks.org での使用状況
- ta.wikipedia.org での使用状況
このファイルのグローバル使用状況を表示する。