
ファイル:RiemannCriticalLine.svg

この SVG ファイルのこの PNG プレビューのサイズ: 800 × 372 ピクセル. その他の解像度: 320 × 149 ピクセル | 640 × 298 ピクセル | 1,024 × 476 ピクセル | 1,280 × 595 ピクセル | 2,560 × 1,191 ピクセル | 933 × 434 ピクセル。
元のファイル (SVG ファイル、933 × 434 ピクセル、ファイルサイズ: 50キロバイト)
ウィキメディア・コモンズのファイルページにある説明を、以下に表示します。
|
W3C-validity not checked.
概要
| 解説 |
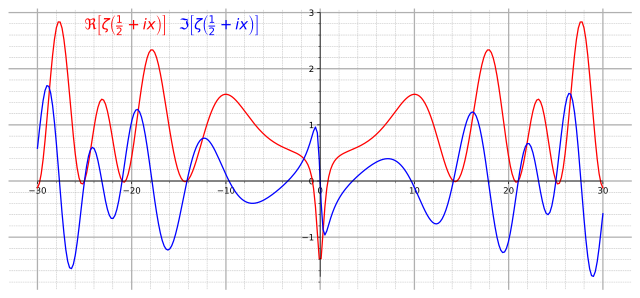
English: Graph of real (red) and imaginary (blue) parts of the critical line Re(z)=1/2 of the Riemann zeta function. |
||
| 日付 | |||
| 原典 |
Own work. Made with Mathematica using the following code: Show[Plot[{Re[Zeta[1/2+I x]], Im[Zeta[1/2+I x]]}, {x,-30, 30},AxesLabel->{"x"} , PlotStyle->{Red, Blue}, Ticks->{Table[4x-28,{x,0,14}]}, ImageSize->{800,600}],
Graphics[Text[Style[\[DoubleStruckCapitalR][\[Zeta][ I x + "1/2"]],14,Red ,Background ->White],{-22,2.6} ]],
Graphics[Text[Style[\[GothicCapitalI][\[Zeta][ I x + "1/2"]],14,Blue ,Background ->White],{-14,2.6} ]]] |
||
| 作者 | Slonzor | ||
| 許可 (ファイルの再利用) |
Public Domain | ||
| SVG 開発 | |||
| ソースコード | Python code
|
ライセンス
| この著作物の著作権者である私は、この著作物における権利を放棄しパブリックドメインとします。これは全世界で適用されます。 一部の国では、これが法的に可能ではない場合があります。その場合は、次のように宣言します。 私は、あらゆる人に対して、法により必要とされている条件を除き、如何なる条件も課すことなく、あらゆる目的のためにこの著作物を使用する権利を与えます。 |
ファイルの履歴
過去の版のファイルを表示するには、その版の日時をクリックしてください。
| 日付と時刻 | サムネイル | 寸法 | 利用者 | コメント | |
|---|---|---|---|---|---|
| 現在の版 | 2017年8月23日 (水) 20:01 | | 933 × 434 (50キロバイト) | Krishnavedala | much reduced vector version |
| 2009年9月24日 (木) 22:28 |  | 800 × 600 (122キロバイト) | Geek3 | linewidth=1px | |
| 2008年11月20日 (木) 19:33 |  | 800 × 600 (122キロバイト) | Slonzor | Man i've messed this up a lot of times. | |
| 2008年11月20日 (木) 19:27 |  | 800 × 600 (3.36メガバイト) | Slonzor | ||
| 2008年11月20日 (木) 19:23 |  | 800 × 600 (3.36メガバイト) | Slonzor | ||
| 2008年11月20日 (木) 19:18 |  | 800 × 600 (3.36メガバイト) | Slonzor | ||
| 2008年11月20日 (木) 19:13 |  | 800 × 600 (79キロバイト) | Slonzor | {{Information |Description={{en|1=Graph of real (red) and imaginary (blue) parts of the critical line Re(z)=1/2 of the Riemann zeta function.}} |Source=Own work. Made with Mathematica using the following code: <code><nowiki>Show[Plot[{Re[Zeta[1/2+I x]], |
ファイルの使用状況
グローバルなファイル使用状況
以下に挙げる他のウィキがこの画像を使っています:
- ar.wikipedia.org での使用状況
- ba.wikipedia.org での使用状況
- be.wikipedia.org での使用状況
- ca.wikipedia.org での使用状況
- ckb.wikipedia.org での使用状況
- da.wikipedia.org での使用状況
- el.wikipedia.org での使用状況
- en.wikipedia.org での使用状況
- eo.wikipedia.org での使用状況
- eu.wikipedia.org での使用状況
- fa.wikipedia.org での使用状況
- fi.wikipedia.org での使用状況
- he.wikipedia.org での使用状況
- hi.wikipedia.org での使用状況
- hy.wikipedia.org での使用状況
- id.wikipedia.org での使用状況
- it.wikipedia.org での使用状況
- it.wikiquote.org での使用状況
- ko.wikipedia.org での使用状況
- la.wikipedia.org での使用状況
- mn.wikipedia.org での使用状況
- nn.wikipedia.org での使用状況
- no.wikipedia.org での使用状況
- pa.wikipedia.org での使用状況
- pt.wikipedia.org での使用状況
- ru.wikipedia.org での使用状況
- sl.wikipedia.org での使用状況
- sq.wikipedia.org での使用状況
- sr.wikipedia.org での使用状況
- uk.wikipedia.org での使用状況
- vi.wikipedia.org での使用状況
- zh-yue.wikipedia.org での使用状況
- zh.wikipedia.org での使用状況