
ファイル:Prime number theorem ratio convergence.svg

この SVG ファイルのこの PNG プレビューのサイズ: 250 × 160 ピクセル. その他の解像度: 320 × 205 ピクセル | 640 × 410 ピクセル | 1,024 × 655 ピクセル | 1,280 × 819 ピクセル | 2,560 × 1,638 ピクセル。
元のファイル (SVG ファイル、250 × 160 ピクセル、ファイルサイズ: 87キロバイト)
ウィキメディア・コモンズのファイルページにある説明を、以下に表示します。
|
概要
| 解説 |
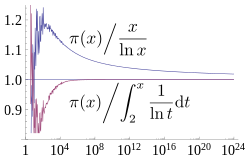
English: A plot showing how two estimates described by the prime number theorem, and converge asymptotically towards , the number of primes less than x. The x axis is and is logarithmic (labelled in evenly spaced powers of 10), going up to 1024, the largest for which is currently known. The former estimate converges extremely slowly, while the latter has visually converged on this plot by 108. Source used to generate this chart is shown below. |
| 日付 | |
| 原典 | 投稿者自身による著作物 |
| 作者 | Dcoetzee |
| SVG 開発 |


ライセンス
この作品の著作権者である私は、この作品を以下のライセンスで提供します。
| このファイルはクリエイティブ・コモンズ CC0 1.0 全世界 パブリック・ドメイン提供のもとで利用可能にされています。 | |
| ある作品に本コモンズ証を関連づけた者は、その作品について世界全地域において著作権法上認められる、その者が持つすべての権利(その作品に関する権利や隣接する権利を含む。)を、法令上認められる最大限の範囲で放棄して、パブリック・ドメインに提供しています。
この作品は、たとえ営利目的であっても、許可を得ずに複製、改変・翻案、配布、上演・演奏することが出来ます。 |
Source
All source released under CC0 waiver.
Mathematica source to generate graph (which was then saved as SVG from Mathematica):
(* Sample both functions at 600 logarithmically spaced points between \
1 and 2^40 *)
base = N[E^(24 Log[10]/600)];
ratios = Table[{Round[base^x],
    N[PrimePi[Round[base^x]]/(base^x/(x*Log[base]))]}, {x, 1,
    Floor[40/Log[2, base]]}];
ratiosli =
  Table[{Round[base^x],
    N[PrimePi[
       Round[base^x]]/(LogIntegral[base^x] - LogIntegral[2])]}, {x,
    Ceiling[Log[base, 2]], Floor[40/Log[2, base]]}];
(* Supplement with larger known PrimePi values that are too large for \
Mathematica to compute *)
LargePiPrime = {{10^13, 346065536839}, {10^14, 3204941750802}, {10^15,
     29844570422669}, {10^16, 279238341033925}, {10^17,
    2623557157654233}, {10^18, 24739954287740860}, {10^19,
    234057667276344607}, {10^20, 2220819602560918840}, {10^21,
    21127269486018731928}, {10^22, 201467286689315906290}, {10^23,
    1925320391606803968923}, {10^24, 18435599767349200867866}};
ratios2 =
  Join[ratios,
   Map[{#[[1]], N[#[[2]]]/(#[[1]]/(Log[#[[1]]]))} &, LargePiPrime]];
ratiosli2 =
  Join[ratiosli,
   Map[{#[[1]], N[#[[2]]]/(LogIntegral[#[[1]]] - LogIntegral[2])} &,
    LargePiPrime]];
(* Plot with log x axis, together with the horizontal line y=1 *)
Show[LogLinearPlot[1, {x, 1, 10^24}, PlotRange -> {0.8, 1.25}],
 ListLogLinearPlot[{ratios2, ratiosli2}, Joined -> True],
 LabelStyle -> FontSize -> 14]
LaTeX source for labels:
$$ \left.{\pi(x)}\middle/{\frac{x}{\ln x}}\right. $$
$$ \left.{\pi(x)}\middle/{\int_2^x \frac{1}{\ln t} \mathrm{d}t}\right. $$
These were converted to SVG with [1] and then the graph was embedded into the resulting document in Inkscape. Axis fonts were also converted to Liberation Serif in Inkscape.
ファイルの履歴
過去の版のファイルを表示するには、その版の日時をクリックしてください。
| 日付と時刻 | サムネイル | 寸法 | 利用者 | コメント | |
|---|---|---|---|---|---|
| 現在の版 | 2013年3月21日 (木) 13:07 | | 250 × 160 (87キロバイト) | Dcoetzee | Change n to x to match article |
| 2013年3月21日 (木) 12:30 |  | 250 × 160 (86キロバイト) | Dcoetzee | Convert formula from graphics to pure SVG using http://www.tlhiv.org/ltxpreview/ | |
| 2013年3月21日 (木) 12:23 |  | 250 × 160 (130キロバイト) | Dcoetzee | {{Information |Description ={{en|1=A plot showing how two estimates described by the prime number theorem, <math>\frac{n}{\ln n}</math> and <math>\int_2^n \frac{1}{\ln t} \mathrm{d}t = Li(n) = li(n) - li(2)</math> converge asymptotically towards <ma... |
ファイルの使用状況
以下のページがこのファイルを使用しています:
グローバルなファイル使用状況
以下に挙げる他のウィキがこの画像を使っています:
- ar.wikipedia.org での使用状況
- bn.wikipedia.org での使用状況
- ca.wikipedia.org での使用状況
- el.wikipedia.org での使用状況
- en.wikipedia.org での使用状況
- fa.wikipedia.org での使用状況
- he.wikipedia.org での使用状況
- hu.wikipedia.org での使用状況
- hy.wikipedia.org での使用状況
- id.wikipedia.org での使用状況
- no.wikipedia.org での使用状況
- pl.wikipedia.org での使用状況
- sl.wikipedia.org での使用状況
- sr.wikipedia.org での使用状況
- sv.wikipedia.org での使用状況
- ta.wikipedia.org での使用状況
- vi.wikipedia.org での使用状況