
ファイル:Leverage Ratios.png

元のファイル (960 × 720 ピクセル、ファイルサイズ: 8キロバイト、MIME タイプ: image/png)
ウィキメディア・コモンズのファイルページにある説明を、以下に表示します。
|
概要

|
このファイルのベクター画像 (SVG) が利用できます。 使う目的に対し、元画像よりもSVGがより優れている場合、SVG画像を使用して下さい。
File:Leverage Ratios.png → File:Leverage ratios for major investment banks.svg
|
 |
| 解説 |
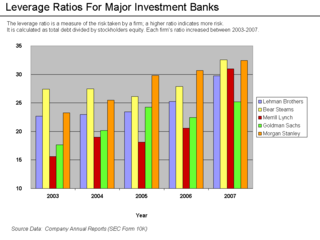
English: Leverage ratios of investment banks ExplanationEach of the five largest investment banks took on greater risk leading up to the subprime crisis. This is summarized by their leverage ratio, which is the ratio of total debt to total equity. A higher ratio indicates more risk. From fiscal years 2003-2007, these firms significantly increased their leverage ratios. A ratio of 10-15 is more typical of a conservative bank. These firms had ratios closer to 30. A highly leveraged institution can have its equity wiped out due to relatively minor swings in the value of its assets. For example, let's suppose an investment bank has $310 in assets, $300 in debt and $10 in equity capital. This is a leverage ratio of 300/10 or 30-to-1. It is an accounting identity (a rule that must be true by definition) that assets equals the sum of liabilities and equity. Now suppose the value of the assets declines by about 3% to $300. The institution still owes its debt holders $300, so equity must be zero. Many financial institutions are facing this scenario. To get more equity or capital, they typically issue new common stock shares to the public in exchange for funds. However, this dilutes the ownership of current shareholders, placing downward pressure on the stock price. When share prices have been reduced as was the case in 2008, a larger and more dilutive issuance of shares is required. In some cases, new share issuance is done at below the current market value. It is noteworthy that the leverage ratios at Morgan Stanley and Goldman Sachs were both under 15 as of Q1 2009, according to their Q1 financial reports available on their websites. Source Datathumb|Source data for the Graph Source data is the 2007 Annual Reports (SEC Form 10K) for each firm. Search the PDF for "Selected Financial Data" so you get the 5-year comparison. Bear's is a bit tougher to find through their website, as it is now part of JP Morgan.
|
| 日付 | |
| 原典 | Annual Reports; Chart by Farcaster |
| 作者 | Farcaster (talk) 19:59, 16 October 2008 (UTC) |
ライセンス
- あなたは以下の条件に従う場合に限り、自由に
- 共有 – 本作品を複製、頒布、展示、実演できます。
- 再構成 – 二次的著作物を作成できます。
- あなたの従うべき条件は以下の通りです。
- 表示 – あなたは適切なクレジットを表示し、ライセンスへのリンクを提供し、変更があったらその旨を示さなければなりません。これらは合理的であればどのような方法で行っても構いませんが、許諾者があなたやあなたの利用行為を支持していると示唆するような方法は除きます。
- 継承 – もしあなたがこの作品をリミックスしたり、改変したり、加工した場合には、あなたはあなたの貢献部分を元の作品とこれと同一または互換性があるライセンスの下に頒布しなければなりません。

|
この文書は、フリーソフトウェア財団発行のGNUフリー文書利用許諾書 (GNU Free Documentation License) 1.2またはそれ以降のバージョンの規約に基づき、複製や再配布、改変が許可されます。不可変更部分、表紙、背表紙はありません。このライセンスの複製は、GNUフリー文書利用許諾書という章に含まれています。 |
元のアップロードログ
- 2008-10-16 19:59 Farcaster 960×720× (8284 bytes) {{Information |Description=Leverage ratios of investment banks |Source=Annual Reports; Chart by Farcaster |Date=October 16 2008 |Author=~~~~ |other_versions= }}
ファイルの履歴
過去の版のファイルを表示するには、その版の日時をクリックしてください。
| 日付と時刻 | サムネイル | 寸法 | 利用者 | コメント | |
|---|---|---|---|---|---|
| 現在の版 | 2010年10月14日 (木) 01:02 | | 960 × 720 (8キロバイト) | Hideokun | {{Information |Description={{en|Leverage ratios of investment banks<br/> ==Explanation== Each of the five largest investment banks took on greater risk leading up to the subprime crisis. This is summarized by their leverage ratio, which is the ratio of t |
ファイルの使用状況
以下の 2 ページがこのファイルを使用しています:
グローバルなファイル使用状況
以下に挙げる他のウィキがこの画像を使っています:
- en.wikipedia.org での使用状況
- es.wikipedia.org での使用状況
- ga.wikipedia.org での使用状況
- gu.wikipedia.org での使用状況
- hi.wikipedia.org での使用状況
- kn.wikipedia.org での使用状況
- lt.wikipedia.org での使用状況
- ta.wikipedia.org での使用状況