
ファイル:Hyperbola.svg

この SVG ファイルのこの PNG プレビューのサイズ: 595 × 586 ピクセル. その他の解像度: 244 × 240 ピクセル | 487 × 480 ピクセル | 780 × 768 ピクセル | 1,040 × 1,024 ピクセル | 2,079 × 2,048 ピクセル。
元のファイル (SVG ファイル、595 × 586 ピクセル、ファイルサイズ: 114キロバイト)
ウィキメディア・コモンズのファイルページにある説明を、以下に表示します。
|
概要
| 解説 |
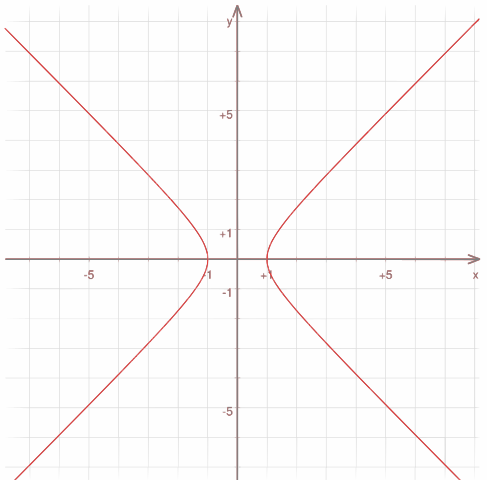
A hyperbola. Made in KMPlot from the parametric function x=cosh(t), y=sinh(t). The graph was then mirrored around the y-axis in Inkscape to form the left-hand side.
|
| 原典 | |
| 作者 |
ライセンス
| この著作物の著作権者である私は、この著作物における権利を放棄しパブリックドメインとします。これは全世界で適用されます。 一部の国では、これが法的に可能ではない場合があります。その場合は、次のように宣言します。 私は、あらゆる人に対して、法により必要とされている条件を除き、如何なる条件も課すことなく、あらゆる目的のためにこの著作物を使用する権利を与えます。 |
ファイルの履歴
過去の版のファイルを表示するには、その版の日時をクリックしてください。
| 日付と時刻 | サムネイル | 寸法 | 利用者 | コメント | |
|---|---|---|---|---|---|
| 現在の版 | 2010年5月1日 (土) 14:05 | | 595 × 586 (114キロバイト) | DieBuche | 2nd try |
| 2010年5月1日 (土) 14:02 |  | 1,024 × 1,024 (174キロバイト) | DieBuche | rmv raster image | |
| 2007年4月10日 (火) 03:27 |  | 1,024 × 1,024 (174キロバイト) | Doctormatt | Reverted to earlier revision | |
| 2007年4月10日 (火) 03:26 |  | 1,642 × 1,642 (687キロバイト) | Doctormatt | Reverted to earlier revision | |
| 2007年4月2日 (月) 01:20 |  | 1,024 × 1,024 (174キロバイト) | Jesin | Reverted to earlier revision | |
| 2007年4月2日 (月) 01:19 |  | 1,642 × 1,642 (687キロバイト) | Jesin | Reverted to earlier revision | |
| 2007年3月17日 (土) 01:36 |  | 1,024 × 1,024 (174キロバイト) | NielsF | Originally uploaded as Image:Hyperbol.svg, per request of User:Jesin: 16 mrt 2007 20:40 . . Jesin (Overleg | bijdragen | blokkeer) . . 1024×1024 (178.339 bytes) (The hyperbola in the current version of the file is made up of blobs, and not all o | |
| 2006年7月3日 (月) 20:16 |  | 1,642 × 1,642 (687キロバイト) | Wereon | A hyperbola. Made in KMPlot from the parametric function x=cosh(t), y=sinh(t). The graph was then mirrored around the y-axis in Inkscape to form the left-hand side. |
ファイルの使用状況
以下のページがこのファイルを使用しています:
グローバルなファイル使用状況
以下に挙げる他のウィキがこの画像を使っています:
- af.wikipedia.org での使用状況
- ar.wikipedia.org での使用状況
- bs.wikipedia.org での使用状況
- en.wikipedia.org での使用状況
- en.wiktionary.org での使用状況
- et.wikipedia.org での使用状況
- fr.wikipedia.org での使用状況
- hi.wikipedia.org での使用状況
- id.wikipedia.org での使用状況
- nl.wikipedia.org での使用状況
- nn.wikipedia.org での使用状況
- ro.wikipedia.org での使用状況
- sl.wikipedia.org での使用状況
- sv.wiktionary.org での使用状況
- ta.wikipedia.org での使用状況
- tr.wikipedia.org での使用状況
- uk.wikipedia.org での使用状況