
ファイル:GHG per capita 2000.svg

元のファイル (SVG ファイル、940 × 477 ピクセル、ファイルサイズ: 1.98メガバイト)
ウィキメディア・コモンズのファイルページにある説明を、以下に表示します。
|
概要
| 解説 |
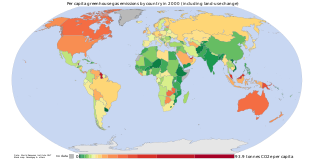
Greenhouse gas emissions per capita in 2000 Data from the World Resources Institute's CAIT 4.0 database (registration required). Includes CO2, CH4, N20, PFCs, HFCs and SF6. Estimates of the effects of land-use change are included; bunker-fuel emissions are not. The land-use estimates include the following (list from the relevant CAIT data note):
Also from the CAIT data note: "It is also important to note that the calculated flux of carbon does not explicitly include changes in carbon stocks that may result from various forms of management. Examples of what is not included are agricultural intensification, fertilization, the trend to no-till agriculture, thinning of forests, changes in species or varieties, and other silvicultural practices." And the data note warns that "these estimates of national sources and sinks of carbon from land-use change are uncertain on the order of +/- 150% for large fluxes, and +/- 50 MtC/yr for estimates near zero." So CAIT's land-use estimates are a bit wild. They are, however, the best currently available at a national level. |
| 日付 | 03/9/07 |
| 原典 | self-made using data from the World Resources Institute and a blank map by Canuckguy and others |
| 作者 | Vinny Burgoo |
ライセンス

|
この文書は、フリーソフトウェア財団発行のGNUフリー文書利用許諾書 (GNU Free Documentation License) 1.2またはそれ以降のバージョンの規約に基づき、複製や再配布、改変が許可されます。不可変更部分、表紙、背表紙はありません。このライセンスの複製は、GNUフリー文書利用許諾書という章に含まれています。 |
| このファイルはクリエイティブ・コモンズ 表示-継承 3.0 非移植ライセンスのもとに利用を許諾されています。 | ||
| ||
| このライセンスのテンプレートは、GFDLのライセンス・アップデートによりこのファイルに追加されたものです。 |
ファイルの履歴
過去の版のファイルを表示するには、その版の日時をクリックしてください。
| 日付と時刻 | サムネイル | 寸法 | 利用者 | コメント | |
|---|---|---|---|---|---|
| 現在の版 | 2007年9月16日 (日) 20:32 | | 940 × 477 (1.98メガバイト) | Vinny Burgoo | 3 or 4 countries in wrong colour band (incl China): corrected. |
| 2007年8月31日 (金) 21:25 |  | 940 × 477 (1.98メガバイト) | Vinny Burgoo | Per capita greenhouse gas emissions by country in 2000 including land-use change. The data was compiled by the World Resources Institute from several sources. I used Canuckguy's version of someone else's blank map. This update corrects the colour of the | |
| 2007年8月29日 (水) 23:54 |  | 940 × 477 (1.98メガバイト) | Vinny Burgoo | {{Information |Description=Per capita greenhouse gas emissions by country (including land-use change) |Source=self-made |Date=30/8/07 |Author= Vinny Burgoo }} |
ファイルの使用状況
以下のページがこのファイルを使用しています:
グローバルなファイル使用状況
以下に挙げる他のウィキがこの画像を使っています:
- ar.wikipedia.org での使用状況
- bg.wikipedia.org での使用状況
- bn.wikipedia.org での使用状況
- bs.wikipedia.org での使用状況
- de.wikipedia.org での使用状況
- en.wikipedia.org での使用状況
- es.wikipedia.org での使用状況
- fr.wikipedia.org での使用状況
- gu.wikipedia.org での使用状況
- hi.wikipedia.org での使用状況
- hu.wikipedia.org での使用状況
- id.wikipedia.org での使用状況
- it.wikipedia.org での使用状況
- no.wikipedia.org での使用状況
- pa.wikipedia.org での使用状況
- pl.wikipedia.org での使用状況
- pt.wikipedia.org での使用状況
- ta.wikipedia.org での使用状況
- te.wikipedia.org での使用状況
- th.wikipedia.org での使用状況
- tr.wikipedia.org での使用状況
- uk.wikipedia.org での使用状況
- vi.wikipedia.org での使用状況
- zh.wikipedia.org での使用状況