
ファイル:Bank Common Equity to Assets Ratios 2004 - 2008.png
元のファイル (960 × 720 ピクセル、ファイルサイズ: 12キロバイト、MIME タイプ: image/png)
ウィキメディア・コモンズのファイルページにある説明を、以下に表示します。
|
概要
| 解説 |
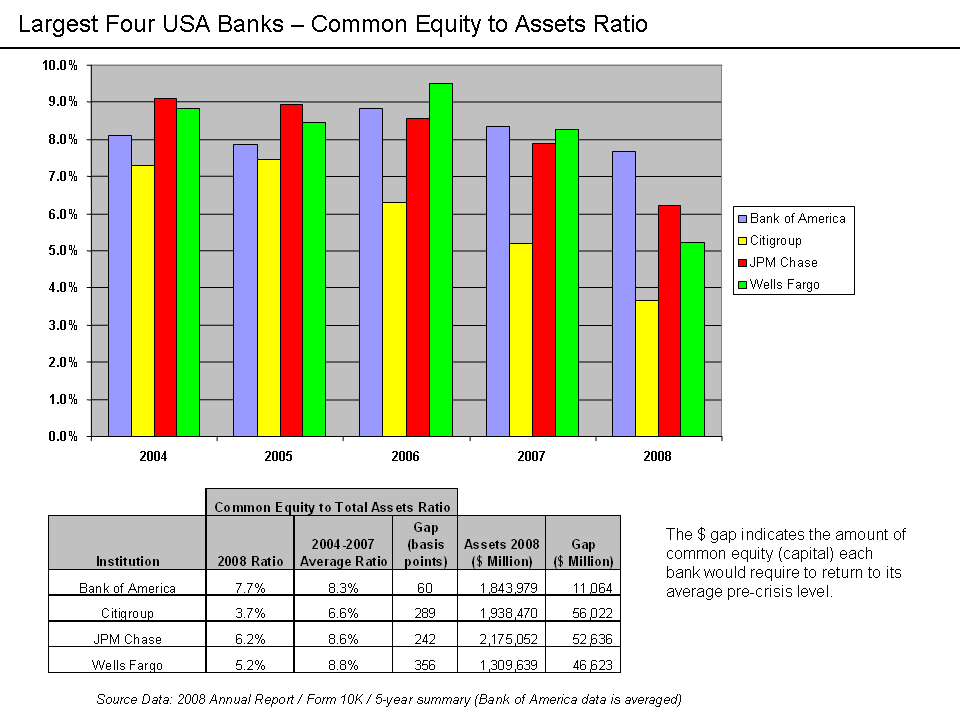
English: Common Equity to Total Assets Ratios for major U.S. banks Source DataThe source data is from the 2008 annual reports of each company available on their website. There is a five year annual summary that contains the source data used. Note that Bank of America (unlike the others) averages its numbers. A basis point is 1/100th of a percentage point. The concept of the gap analysis is to indicate how much additional common stock equity each bank would have to acquire to return to its 2004-2007 average ratio. Computation steps:
The amounts are in millions. For example, Wells Fargo would require $46.6 billion to return to its pre-crisis level of common equity capitalization. Alan Greenspan wrote in a March 2009 article that U.S. banks would require another $850 billion in his estimation, representing "an additional 3-4 percentage points of cushion in their equity capital to assets ratios."[1] |
| 日付 | |
| 原典 | Annual Reports of each entity |
| 作者 | Farcaster (talk) 05:12, 4 May 2009 (UTC) |
ライセンス
- あなたは以下の条件に従う場合に限り、自由に
- 共有 – 本作品を複製、頒布、展示、実演できます。
- 再構成 – 二次的著作物を作成できます。
- あなたの従うべき条件は以下の通りです。
- 表示 – あなたは適切なクレジットを表示し、ライセンスへのリンクを提供し、変更があったらその旨を示さなければなりません。これらは合理的であればどのような方法で行っても構いませんが、許諾者があなたやあなたの利用行為を支持していると示唆するような方法は除きます。
- 継承 – もしあなたがこの作品をリミックスしたり、改変したり、加工した場合には、あなたはあなたの貢献部分を元の作品とこれと同一または互換性があるライセンスの下に頒布しなければなりません。

|
この文書は、フリーソフトウェア財団発行のGNUフリー文書利用許諾書 (GNU Free Documentation License) 1.2またはそれ以降のバージョンの規約に基づき、複製や再配布、改変が許可されます。不可変更部分、表紙、背表紙はありません。このライセンスの複製は、GNUフリー文書利用許諾書という章に含まれています。 |
元のアップロードログ
- 2009-05-04 05:12 Farcaster 960×720× (12704 bytes) {{Information |Description = Common Equity to Total Assets Ratios for major U.S. banks |Source = Annual Reports of each entity |Date = May 4, 2009 |Author = ~~~~ |other_versions = }}
ファイルの履歴
過去の版のファイルを表示するには、その版の日時をクリックしてください。
| 日付と時刻 | サムネイル | 寸法 | 利用者 | コメント | |
|---|---|---|---|---|---|
| 現在の版 | 2010年10月14日 (木) 01:11 | | 960 × 720 (12キロバイト) | Hideokun | {{Information |Description={{en|Common Equity to Total Assets Ratios for major U.S. banks<br/> ==Source Data== The source data is from the 2008 annual reports of each company available on their website. There is a five year annual summary that contains th |
ファイルの使用状況
以下のページがこのファイルを使用しています:
グローバルなファイル使用状況
以下に挙げる他のウィキがこの画像を使っています:
- en.wikipedia.org での使用状況
- hi.wikipedia.org での使用状況
- ta.wikipedia.org での使用状況